Web programming is difficult to debug with different languages, web browsers, users around the world all adds to the complexity, the try-catch and throw statements helped but as years have gone by debuggers and debugging tools started to appear in web browsers
All the browsers now have a a way to report errors, generally there is a developers tools option that can be invoked that will allow to debug all sorts for information, console window, sources, network, performance, memory, etc. There are tools for also debugging on mobile devices pluis 3rd party utilities that allow you to connect directly to the mobile device.
Below is chromes network debug page

Error handling was generally performed on the server-side, but over years proper error handling has started to appear in the browser, the try-catch statement is used to try to capture errors and deal with them so that the users experience is not prone to erroring, most programming languages use the try-catch.
| try-catch statement | try {
// code that may cause an error
} catch (error) { // error is an object containing information about the error
// what to do when an error occurs
}
Note: each browser will have different information in the error object. |
You can optionally use a finally clause which will always run no matter what
| finally | try {
// code that may cause an error
} catch (error) { // error is an object containing information about the error
// what to do when an error occurs
} finally {
// code here will always run no matter what
} |
There are a number of error types that can occur, each error type has its own error object when thrown
- Error - the base type from which all other error types inherit from
- InternalError - the underlying Javascript engine throws an exception
- EvalError - thrown when an exception occurs while using the eval() function
- RangeError - when a number is ouitside the bound of its range
- ReferenceError - thrown when an object is excepted
- SyntaxError - thrown when there is a syntax error with the Javascript code
- TypeError - occurs when a varaible is of an unexpected type or an attempt is made to access a non-existent method
- URIError - occurs when using the encodeURI() and decodeURI() with a malformed URI
| try-catch multiple error example | try {
someFunction();
} catch (error){
if (error instanceof TypeError){
// handle type error
} else if (error instanceof ReferenceError){
// handle reference error
} else {
// handle all other error types
}
}
Note: try and use try-catch where errors might occur that is out of your control |
The throw operator can be used to throw a custom error at any time you choose, you must pass at least one argument which can be of any data type, you can also throw a error of a specific error type
| throwing an error | throw 12345;
throw "Hello world!";
throw { name: "JavaScript" };
throw new SyntaxError(".......");
throw new InternalError("........");
throw new TypeError(".............");
throw new RangeError("........");
throw new EvalError("............");
throw new URIError("..........");
throw new ReferenceError("........."); |
You can create your own custom error types by extending Error, you should provide both a name anda message property
| Custom error type | class CustomError extends Error {
constructor(message) {
super(message);
this.name = "CustomError";
this.message = message;
}
}
throw new CustomError("My message"); |
You can setup Javascript to log back to the server providing the server can receive the error, you can add as much details as you like but only send what is required to debug the error, an simple example is below
| log errors to server | function logError(sev, msg) {
let img = new Image(),
encodedSev = encodeURIComponent(sev),
encodedMsg = encodeURIComponent(msg);
img.src = 'log.php?sev=${encodedSev}&msg=${encodedMsg}'; // this can be any web server
} |
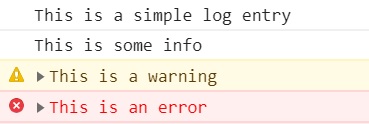
The console is one of the most used tools to debug code, using the console object you can use methods like error, info, log and warn
| console messages | console.log("This is a simple log entry");
console.log("This is some info");
console.warn("This is a warning");
console.error("This is an error"); |
 |
|
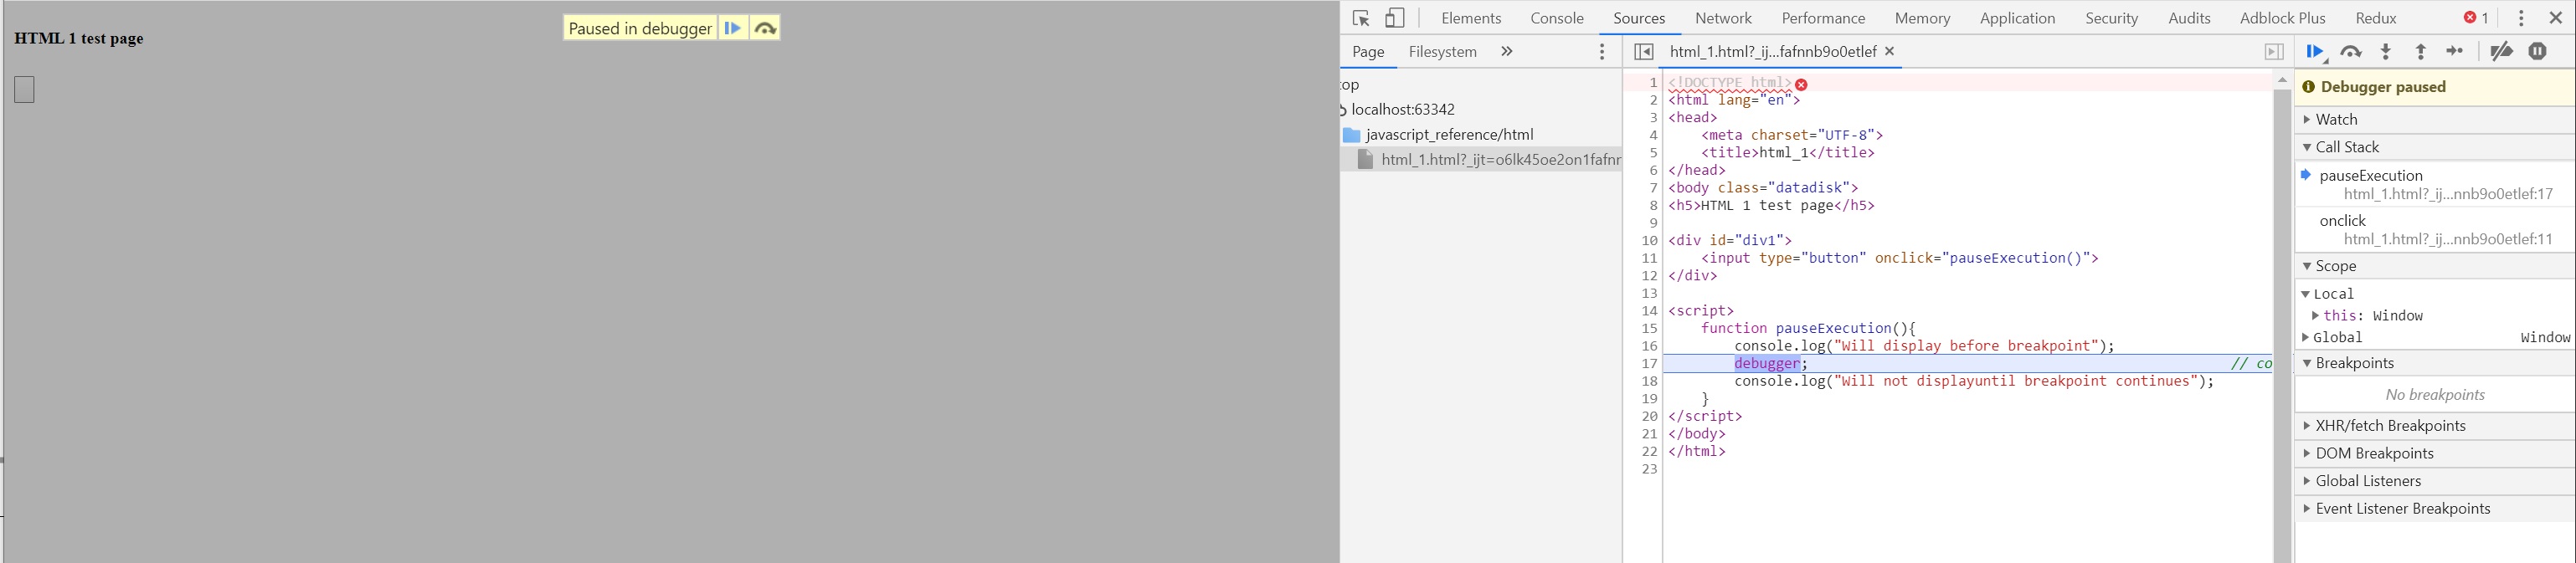
You can insert the debugger statement into your code and the code execution will pause, you can then analyse and then continue the code execution
| debugger | function pauseExecution(){
console.log("Will display before breakpoint");
debugger; // code will pause execution
console.log("Will not displayuntil breakpoint continues");
} |
 |
|