A logical standby mines the primary database redo and reconstructs the higher level SQL operations that resulted in the database change, and then applies these SQL statements to maintain the standby database. The benefits to using a logical standby is that
- It can be open for reads
- Can support indexes and materialized views
- Can add tables, schemas and have read-write access to these tables and schemas (as long as they are not managed by redo apply)
- Perform rolling upgrades, for example the primary may be using 10g and the logical standby could be using 11g
- Idea for testing patch sets
- Idea as a staging system to propagate changes
There are three major aspects when dealing with a logical standby
| Dataset available at the logical standby |
you need to characterize what tables are maintained at the logical standby database an how to customize the set of replicate tables. You also need to understand how to use the true power of a logical standby database by allowing the use of creating additional schema objects such as tables, materialized views, indexes, etc |
| Steady state operational issues |
you need to focus on the redo transport by making sure that redo generated from the primary database arrives at the standby site promptly and all network disconnects are handled correctly, you also need to make sure that the SQL apply provides as near real-time reports and queries, this is what we will focus in this section |
| Role transitions |
role transition can be more complex in a logical standby as opposed to steady state operational processes, because application connectivity needs to be considered. |
We will start off by explaining what gets replicated, how replicated data is protected from modifications and how you can write customized solutions. Data Guard logical standby will replicate database schema objects unless they fall under the below categories
- The object belongs to the set of internal schema that SQL Apply does not maintain explicitly
- The object contains a data type for which native redo-based support is lacking in SQL apply
- The object is the target of an explicit skip rule specified by the DBA
To determine the set of internal schemas not maintained by the SQL apply or if tables don't support certain data types you can use the following queries, you can see what schemas and tables my primary database does not support
| schema that are not maintained by SQL apply |
select owner from dba_logstdby_skip where statement_opt = 'INTERNAL SCHEMA' order by owner;
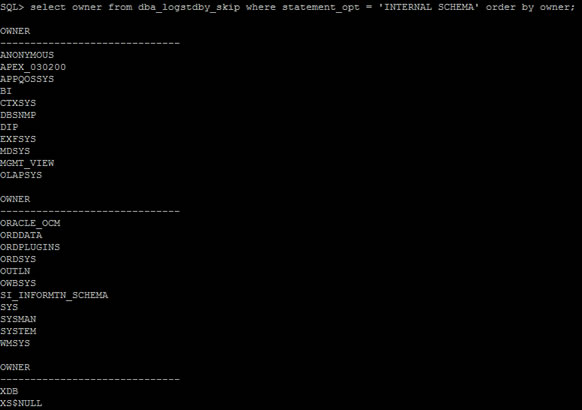
Note: system and sys schema are not replicated so don't go creating tables in these schemas, the above command should return about 17 schemas (Oracle 11g) that are replicated. |
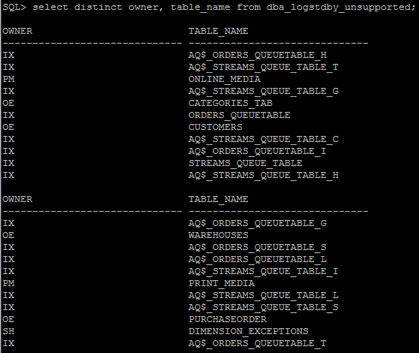
| Check tables with unsupported data types |
select distinct owner, table_name from dba_logstdby_unsupported;
select owner, table_name from logstdby_unsupported_tables;
|
You can specify which tables that you don't want to replicate, remember the redo will be transported across but the SQL apply will not happen
| skip replication of tables |
## Syntax
dbms_logstdby.skip (
stmt in varchar2,
schema_name in varchar2 default null,
object_name in varchar2 default null,
proc_name in varchar2 default null,
use_like in boolean default true,
esc in char1 default null
);
## Examples
execute dbms_logstdby.skip(stmt => 'DML', schema_name => 'HR', object_name => 'EMPLOYEE');
execute dbms_logstdby.skip(stmt => 'SCHEMA_DDL', schema_name => 'HR', object_name => 'EMPLOYEE');
# skip all DML operations
execute dbms_logstdby.skip(stmt => 'DML', schema_name => 'HR', object_name => '%');
|
| revoke a skipped table |
stop SQL apply
execute dbms_logstdby.instantiate_table(schema_name => 'HR', table_name => 'EMPLOYEE', DBLINK => 'INSTANTIATE_TABLE_LINK');
execute dbms_logstdby.skip(stmt => 'DML', schema_name => 'HR', object_name => 'EMPLOYEE');
start SQL apply
Note: the dblink should point to the primary database, we have to stop SQL apply as the instantiate table procedure uses Oracle's data pump network interface to lock the source table to obtain the SCN at the primary database, it then releases the lock and gets a consistent snapshot of the table from the primary database, it remembers the SCN associated with the consistent snapshot. |
| display what tables are being skipped |
select owner, name, use_like, esc from dba_logstdby_skip where statement_opt = 'DML';
|
Now that you know what schemas and tables are being protected what stops you from modifying the database, with a physical server the database is in mounted or read-only mode but a logical standby is an open, read/write database. A database guard can have three possible values
- NONE - users are free to modify any schema or table (the primary database will be in this mode)
- STANDBY - users cannot modify any replicated schemas or tables, but they are free to create there own schemas, tables or views
- ALL - this is the most restrictive no modifications are allowed
None and all can be used on all database types (primary, physical and logical), standby is only meaningful on logical standby databases.
| Display the guard |
select guard_status from v$database;
GUARD_S
-------
NONE |
| setting the guard on a database |
alter database guard standby; |
Creating a Logical Standby
Firstly create a physical standby database which I have already discussed, if you are using a broker do not add it to the broker yet, otherwise you will need to remove from the broker. Once the physical standby is synchronized with the primary database, shutdown the MRP process using the below command
| Stop the MRP process |
alter database recover managed standby database cancel; |
The reason for stopping the process is that you are going to build the logMiner dictionary and you don't past the point of the primary database. If you are not using a flash recovery area, you must modify your local archiving parameters on the primary database to point the archiving of the ORL files to one directory and the archiving of the SRL files to another directory if the primary might ever become a logical standby due to role transition, the reason for splitting is due to the fact that in previous versions a logical standby's incoming archive log files could not be placed in the flash recovery area. This was because the flash recovery area did not know what they were and considered them "foreign" files, so did nothing with them. You need to read the Oracle Data Guard manual to get more information about this but as I am using a flash recovery area I need to make no changes.
We now need to build the logical standby dictionary, which is carried out from the primary
| build the dictionary |
execute dbms_logstdby.build; |
This basically performs the following
- Enables supplemental logging on the primary database
- Builds the LogMiner dictionary of the primary database metadata so that the logical standby will know what to do with the redo that is being sent from the primary.
- Figures out how far in the redo the MRP will have to process the redo to apply all transactions that occurred before the build
- Identifies at what SCN in the redo SQL Apply has to start mining redo to get all the transactions that committed after the MRP finished apply redo to the physical standby database
If you have other physical standby within you environment you must run the below command to enable supplemental logging, other than updating the control file nothing will happen unless the physical standby becomes the primary at which point it would start generating redo with the supplemental logging.
| enable supplemental logging on other physical databases |
alter database add supplemental log data (primary key, unique index) columns; |
If you are using a RAC environment you need to shutdown all other instances and disable the cluster
| shutdown all instances (RAC only) |
alter system set cluster_database=false scope=spfile;
shutdown immediate;
startup mount exclusive; |
Before carrying out the next steps you need to make sure of the following (which is what you just performed above)
- Create a physical standby database
- Let it get synchronized with the primary
- Stopped the MRP
- Built the LogMiner dictionary
- Made the standby a single instance (if using RAC)
You are ready to tell the MRP that it needs to continue apply redo but only to the recovery point SCN that was in place in the redo stream by the dictionary build
| apply redo up to the dictionary build |
alter database recover to logical standby PROD1LR; |
If this commands hangs then you forgot to build the dictionary, just cancel the command and repeat the 5 steps above and try again.
At this point you can re-enable your cluster (if using RAC)
| re-enable RAC |
shutdown;
startup mount;
alter database open resetlogs;
|
If you are build a logical standby on the same system as the primary database, then you have to tell the SQL Apply to skip any alter tablespace DDL, otherwise SQL Apply could find the primary or physical standby database files and potentially do some damage when processing any alter tablespace DDL.
| run only if logical standby is on the same system as either a primary or physical database |
# Run this on the logical standby
execute dbms_logstdby.skip('alter tablespace'); |
Final we are nearly there one final command to start the SQL Apply and complete the physical to logical standby process
| start the SQL Apply |
# Run this on the logical standby
alter database start logical standby apply immediate; |
To confirm everything is up and running correctly, use my monitoring section to check everything.
Looking inside SQL Apply
SQL apply is the layer of code that maintains the logical standby database, there are a number components that manage this
- Redo transport service that ships the redo stream of the primary database and performs gap resolution
- The mining service that mines the redo and reconstructs the equivalent SQL statements and original transaction grouping
- The apply service that schedules the mined transactions for concurrent application and actually applies them
- The core database engine that performs the modification as directed by the apply service
The mining and apply engines form a producer-consumer pair, with the mining engine producing transactions to be consumed by the apply engine. The mining engine transforms the redo records into logical change records (LCRs) and stages then in the SGA, you can specify how much SGA will use for the staging of the LCRs. two other producer-consumer setup exists, one formed by the transport service (producer) and the mining engine (consumer), and the other found by the apply engine (producer) and the rest of the RDBMS code (consumer), these are all I/O intensive, so make sure your server has the resources to handle the I/O.
When you issue the command alter database start logical standby apply, the first background process to start is the logical standby coordinator process (LSP0), this is the coordinator process for SQL apply and in turns spawns two sets of processes; the mining processes (these have a prefix of ora_ms) and the apply processes (these have a prefix of ora_as).
The mining engine comprises of the following processes
- Reader - there is only one reader process, its job is to read the redo stream (either from SRLs or archived logs), it does not make any changes to data
- Preparer - there can be multiple preparer's, data guard uses a step function to determine the right number of preparer's with a step of 20, so for the first 20 appliers only a single preparer is spawned, a second preparer will be spawned if the appliers went to between 21 and 40. Each preparer reads a set of redo records and does the initial transformation of the redo records into an LCR, a single redo record can generate multiple LCRs (think of a direct load block)
- Builder - There is only one builder process, it is the process that interfaces with the pipeline between the mining and the apply engines, it handles tasks
- grouping the LCR's into transactions
- merging of multiple LCR's into a single LCR
- performing admin tasks such as paging out memory, advancing the log mining checkpoints, etc
The apply engine comprises of the following processes
- Analyzer - there is only one analyzer process. its job is to fetch transactions from the mining engine and compute a safe schedule that can be used to order the commits of the transaction
- Coordinator - there is only one coordinator process, it coordinates between the appliers, assigning work to the applier process and coordinating commit ordering
- Applier - there can be multiple applier processes, theses are the true workhorses inside the SQL apply engine and they actually replicate the changes.
You can see the processes by using the command below
| List the above processes |
col status for a35;
col type for a25;
select * from v$logstdby_process; |
Basically the SQL engine is a producer-consumer setup with the LCR cache in the middle used as the pipeline, to increase the cache size you can use the command below
| Increase the LCR cache size |
# Set the cache size to 200MB
execute dbms_logstdby.apply_set('MAX_SGA', 200); |
| How much LCR cache is being used |
select used_memory_size from v$logmnr_session where session_id = (select value from v$logstdby_stats where name = 'SESSION_ID'); |
The LCR cache has a number of components
- One area that holds the redo records
- Another area where the redo records are transformed into LCRs (but not yet grouped)
- Another area where LCR's are grouped into transactions and are ready for consumption by the apply component
- Lastly and area that is made up of unused memory
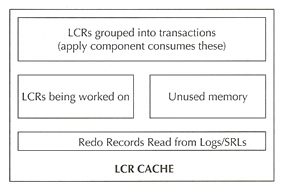
The reader process reads from the redo logs and fills the region allocated for redo records. The preparer's read the redo and perform the first level of transformation from the redo to LCR. The builder process moves the LCRs into the apply visible section of the LCR cache by grouping the LCRs into transactions and performing second-level transformation such as chain row processing, merging LCRs related to LOB DMLs, etc.
If you do not use enough memory the mining engine will pageout memory from LCR cache to disk (system.logmnr_spill$ table), paging is ok at a moderate level but any excessive paging will deteriorate the performance of the standby database.
There are two kinds of checkpoints in SQL apply, the apply engine has to remember which transactions it has successfully applied so that it does not try them again. This is performed by inserting a row identifying the XID that was assigned at the primary database into the metadata table (system.logstdby$apply_progress) as part of he transaction that replicates the changes done at the primary database. SQL apply will purge this table (as it can become huge) by creating a new partition and dropping the old one and it remembers an SCN below which all transactions have been successfully applied. This SCN (shown in v$logstdby_progress.applied_scn) and the rows in system.logstdby$apply_progress form the apply engine's checkpoint information.
The mining engine need a more elaborate checkpoint information, it has a counter part to v$logstdby_progress.applied_scn and this is v$logstdby_progress.restart_scn, the mining engine will read the redo logs that contain redo records with SCN greater than or equal to restart_scn. Because the mining engine has more elaborate information it has to weigh the costs and benefits related to such checkpoints, the name logmnr_age_spills$ suggests what is going on underneath the mining engine is spilling data based on its age.
You have to keep in mind that age is a relative thing, lets say that you are generating 100MB/Hour of redo, you can say that no transaction is old unless it has remained uncommitted for 10 hours, the cost of reading 1GB worth of redo through the mining engine and discarding most of it is quite small it may only take less than a minute, however if you have a system that is generating 10MB/sec you cannot use 10 hours as a reference to determine age because you may have to read 360GB of redo. So the the mining engine computes age based on how much redo has been generated since the candidate redo to determine whether a redo record is old. What's this all means is that as the rate of redo generation increases so do the checkpoint intervals by default the mining engine sets the redo threshold to be 5 x MAX_SGA, so if you are running with MAX_SGA size of 200MB, a redo record will become a candidate for checkpointing once 1GB of redo has ben generated since the time it was mined at the logical standby site.
The second aspect of checkpointing is to avoid checkpoint large transaction (modifying large number of rows), for example suppose you are generating 10MB/sec of redo with a direct load of 10 million rows in one transaction, also presume that each row results in 200 bytes worth of redo, this will generate 2GB worth of redo records. using the default setting of 200MB of MAX_SGA, the mining engine will encounter 1GB of redo for the large load as a candidate for checkpointing. However SQL apply's checkpointing algorithm detects the fact that the transaction is a large transaction and its not cost efficient to checkpoint parts of this transaction, so the mining engine will not checkpoint any data from this transaction. As a result the restart_scn column in v$logstdby_progress will get stuck at the SCN at which the large transaction started modifying the database, until SQL apply has successfully committed all changes made by this large transaction, so if you don't see restart_scn moving along then you may well have encountered a large transaction.
What sets the SQL apply different from other mining engines is its ability to divide large transactions up into chunks and start to work on then before the transaction has committed at he primary database. This has two benefits
- chucks can be applied eagerly thus keeping memory requirements to a minimum
- it also keeps the logical standby close to synchronized to the primary, providing real-time availability of the data regardless of transaction size
SQL apply allows for two modes of transaction application
- commit ordering at the primary database is maintained strictly at the logical standby (default)
- commit ordering is not strictly enforced as long as no rows dependency exists between two transactions (better performance)
| setting SQL apply mode for the application |
execute dbms_logstdby.apply_set (name => 'PRESERVE_COMMIT_ORDER', value => FALSE); |
Strict ordering means that commits are issued and executed in the same order as in the primary, this is set using the parameter preserve_commit_order on the standby (see above).
SQL apply computes it dependencies by computing several hash values for LCR, ne for each unique constraint on the table of interest, and then uses these hash values to determine whether two LCRs have any collisions, if so the transaction with the later commit SCN will wait for the first transaction to commit before applying the change that collided with the former. However i does not compute dependencies for all LCRs as there is a cost associated with every computation, this cost is paid in memory consumption (memory to stage the computation and memory to stage the dependency graph).
There are two points to remember regarding DDL statements
- DDL statements act as a barrier synchronization point in the context of SQL apply
- DDL statements are scheduled serially by SQL apply
Whenever the mining engine encounters a commit redo for a DDL transaction that it needs to examine and apply to its internal data dictionary (also known as LogMiner dictionary) it raises a barrier, the barrier condition is not satisfied until all transactions that have committed before the commit of the DDL transaction have been applied successfully, no new transactions are handed to the analyzer process until the barrier has been lifted. You can view this barrier with the command below
| Determine the number of DDL statements since the last restart |
select name, value from v$logstdby_stats where name = 'DDL TXNS DELIVERED';
NAME VALUE
------------------------------------------------------------------------
DDL TXNS DELIVERED 510 |
| displaying the barrier |
select status_code as sc, status from v$logstdby_process where type = 'BUILDER';
sc status
-------------------------------------------------------------------------------------
44604 BARRIER SYNCHRONIZATION ON DDL WITH XID 1.15.256 (WAITING ON 17 TRANSACTIONS) |
Note that this safety does have a impact for an example suppose that you perform partition maintenance operations on two tables concurrently on the primary database which took one hour, because the logical standby database processes these serially it will take two hours to complete, so remember to offload large reorganization operations to off-peak hours.
Tuning SQL Apply
There are a number of areas that you can tuning to improve the SQL apply engine
- Increase the MAX_SGA parameter that controls the size of the LCR_CACHE
- Increase the throughput of the producer or the mining engine if the producer side of the system is a bottleneck
- Increase the number of mining processes
- check for paging or excessive checkpointing
- Increase the throughput of the consumer or the apply engine, if the consumer side of the system is a bottleneck
- Increase the number of appliers
- check for overabundance of DDL in your workload, this will cause a slowdown
As a rule of thumb here are some suggested values to start with, increase as you see fit as you may have abundance of memory, I have talked about all these tuning options above
| MAX_SERVERS |
# Set the MAX_SERVERS to 8 x the number of cores
execute dbms_logstdby.apply_set ('MAX_SERVERS', 64); |
| MAX_SGA |
# Set the MAX_SGA to 200MB
execute dbms_logstdby.apply_set ('MAX_SGA', 200); |
| _HASH_TABLE_SIZE |
# Set the Hash table size to 10 million
execute dbms_logstdby.apply_set ('_HASH_TABLE_SIZE', 10000000); |
| DDL |
defer DDLs to off-peak hours |
| Preserve commit order |
# Set the PERSERVE_COMMIT_ORDER to false
execute dbms_logstdby.apply_set (name => 'PRESERVE_COMMIT_ORDER', value => FALSE); |
To determine if the SQL apply is lagging run the below command, check the apply lag and the transport lag
| lagging SQL Apply |
# apply lag: indicates how current the replicated data at the logical standby is
# transport lag: indicates how much redo data that has already been generated is missing at the logical # standby in term of redo records
select name, value, unit from v$dataguard_stats;
|
We can drill further by determine which component is causing the bottleneck
| SQL Apply component bottleneck |
select name, value from v$logstdby_stats where name like 'TRANSACTIONS%';
Name Value
-----------------------------------------------------------------------------------------------------
TRANSACTIONS APPLIED 3764
TRANSACTIONS MINED 4985
The mined transactions should be about twice the applied transaction, if this decreases or staying at a low value you need to start looking at the mining engine. |
You can tune the mining in two ways increase the number of preparer's or increase the size of the LCR cache, firstly increasing the number of preparer's needs to be done rarely and only if the following conditions are met
- All preparer processes are busy doing work
- The peak size of the LCR cache is significantly smaller than the maximum allocated for (via the MAX_SGA setting)
- The number of transactions available in the LCR cache is less tan the number of applier processes available
- some applier processes are idle
Here are the commands to determine this
| Make sure all preparers are busy |
select count(1) as idle_preparers from v$logstdby_process where type = 'PREPARER' and STATUS_CODE = 16166;
IDLE_PREPARER
----------------------------
0
|
| Make sure the peak size is well below the amount allocated |
select used_memory_size from v$logmnr_session where session_id = (select value from v$logstdby_stats where name = 'LOGMINER SESSION ID');
USED_MEMORY_SIZE
----------------------------
32522244 |
| verify that the preparer does not have enough work for the applier processes |
select (available_txn - pinned_txn) as pipleline_depth from v$logmnr_session where session_id = (select value from v$logstdby_stats where name = 'LOGMINER SESSION ID');
PIPELINE_DEPTH
----------------------------
8
select count(*) as applier_count from v$logstdby_process where type = 'APPLIER';
APPLIER_COUNT
----------------------------
20
|
SQL apply uses three parameters to control the number of processes
MAX_SERVERS = PREPARE_SERVERS + APPLY_SERVERS + 3
Normally you simply specify MAX_SERVERS and SQL apply divide the available processes among the apply component and mining component. There is a limit to 5 PREPARE_SERVERS, remember we stated above that if yo set MAX_SERVERS to any value between 1 and 20, SQL apply allocates one server process to act as the PREPARER and allocated the rest of the processes as APPLIERS, if you set MAX_SERVERS to a value between 21 and 40, SQL apply will allocated two PREPARERS. However you can set the values your self but make sure that you maintain the relationship.
| Setting max_servers and preparers |
execute dbms_logstdby.apply_set('MAX_SERVERS', 36);
execute dbms_logstdby.apply_set('PREPARE_SERVERS', 3); |
There are 2 cases in which you would increase the LCR cache
Case 1
- overall throughput is lower than expected (see above)
- not enough work is available in the LCR cache (number of available transactions is below number of APPLIERs) (see above)
- Peak value for v$logmnr_session.used_memory_size is almost equal to the amount allocated to the LCR cache (see above)
Case 2
- You see mining processes idle most of the time (the mining engine should be active one-sixth of the time)
- You see mining engine paging out memory at an unacceptable rate (> 5%)
| display the pageout activity |
## Run this first
select name, value from v$logstdby_stats where name like '%PAGE%' or name like '%UPTIME' or name like '%IDLE%';
## Run the second time about 10 mins later
select name, value from v$logstdby_stats where name like '%PAGE%' or name like '%UPTIME' or name like '%IDLE%';
Now subtract one from the other and work out the percentage rate, if pageout has increase above 5% then increase the MAX_SERVERS |
Lastly we can tune the apply engine but make sure the following conditions have been met
- The pipeline between the mining and apply component (LCR cache) has enough work available
- There is no idle APPLIER process or there are unassigned large transactions (see above)
To determine if there are unassigned large transactions use the below
| unassigned large transactions |
## By default SQL apply should be one-sixth of the number of applier processes
select (available_txn - pinned_txn) as pipleline_depth from v$logmnr_session where session_id = (select value from v$logstdby_stats where name = 'LOGMINER SESSION ID');
PIPELINE_DEPTH
----------------------------
256
select count(1) as idle_applier from v$logstdby_process where type = 'APPLIER' and status_code = 16166;
IDLE_APPLIER
---------------------------
12
## Now look for the unassigned large transactions
select value from v$logstdby_stats where name = 'LARGE TXNS WAITING TO BE ASSIGNED';
VALUE
---------------------------
12
|
Troubleshooting SQL Apply
Watching the alert log you may come across a number of SQL apply problems are are some of the common ones.
| ORA-4031 |
This error is to do with the LCR cache and available memory, to satisfy memory requirements SQL apply will first release all the memory from its internal lists to the top-level heap and see if the memory requirement can be met. In very rare circumstances, where the memory fragmentation pattern is such that a refreshing of the internal lists will not do the trick, SQL apply will perform a controlled restart. This is very rare and you should not be alarmed by this type of error |
| ORA-26786 |
The is raised when SQL apply finds the row to be modified using the primary or unique key information contained in the LCR, but the before image of the row does not match the image contained in the LCR
Note: use the skip_failed_transaction when starting the SQL apply process or use the dbms_logstdby.skip_transaction procedure |
| ORA-26787 |
The is raised when SQL cannot find the row to be modified using the primary or unique key information contained in the LCR
Note: use the skip_failed_transaction when starting the SQL apply process or use the dbms_logstdby.skip_transaction procedure |
| ORA-04042 |
This is permission (grant/revoke) on a procedure or function that exists in one of the internally skipped schemas. You can handle this by registering an error handler with the SQL apply to skip errors encountered during the apply of such statements |