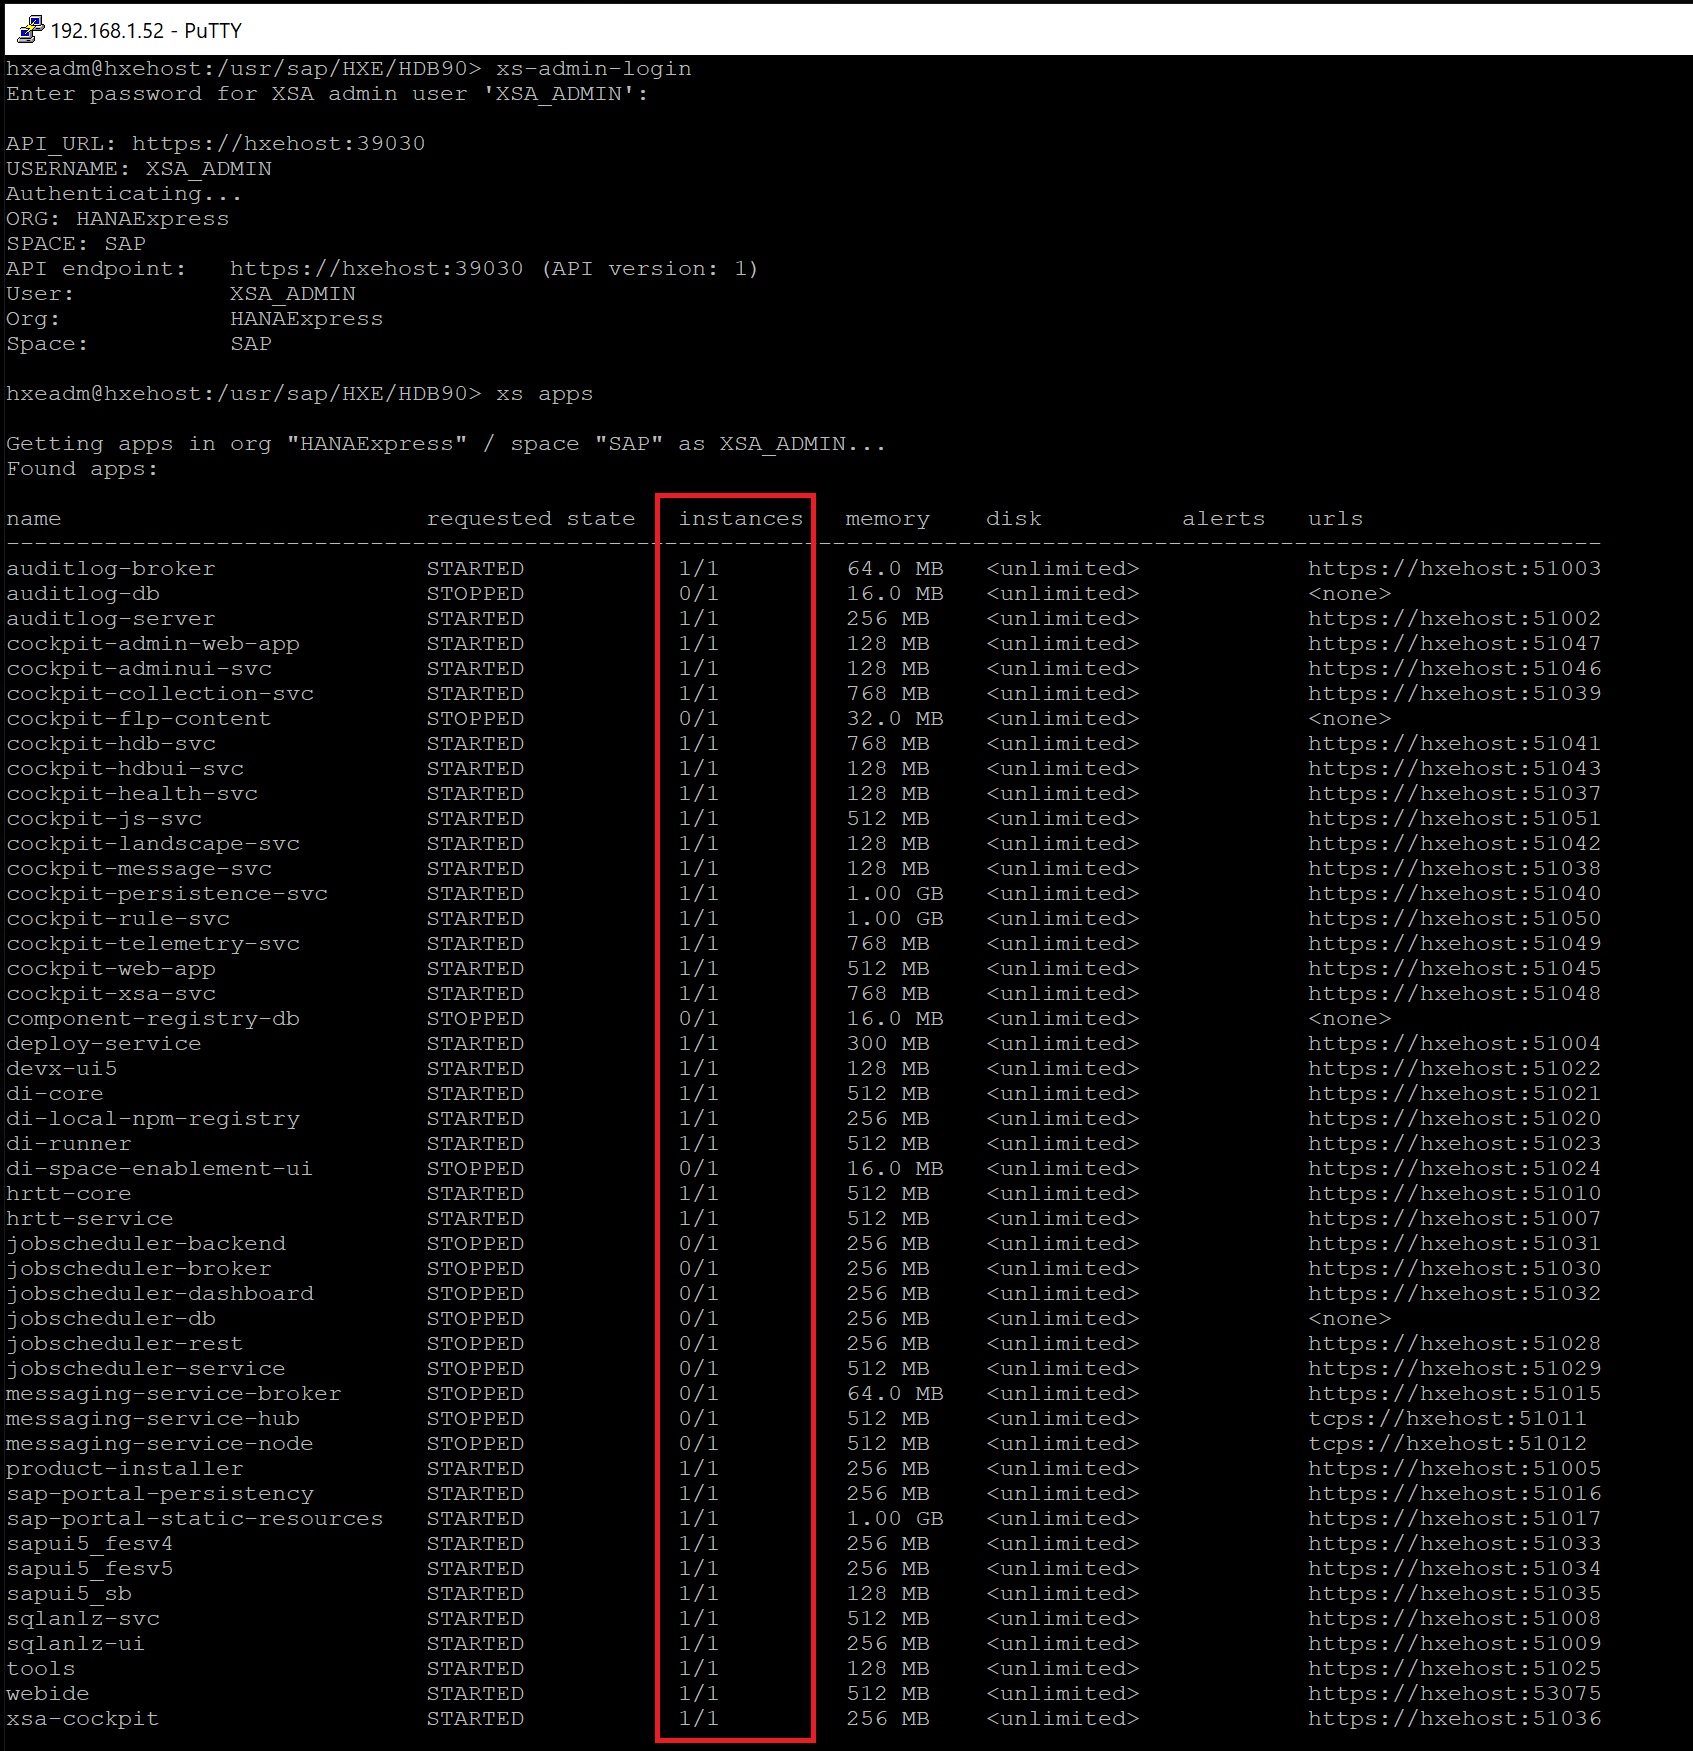
XSA is an application framework which makes development and database access easier for applications, they are a number of services that are started when you start the Hana system, you can view these by logging in using putty and then typing xs-admin-login, then typing xs apps, all the services are then displayed, all services are fully running then the instance is at 1/1, note that it can take up to 30 mins for all the services have started. You can access each of the service using the URL in the urls column. To access the XS admin Note the URL in the output regarding port 39030
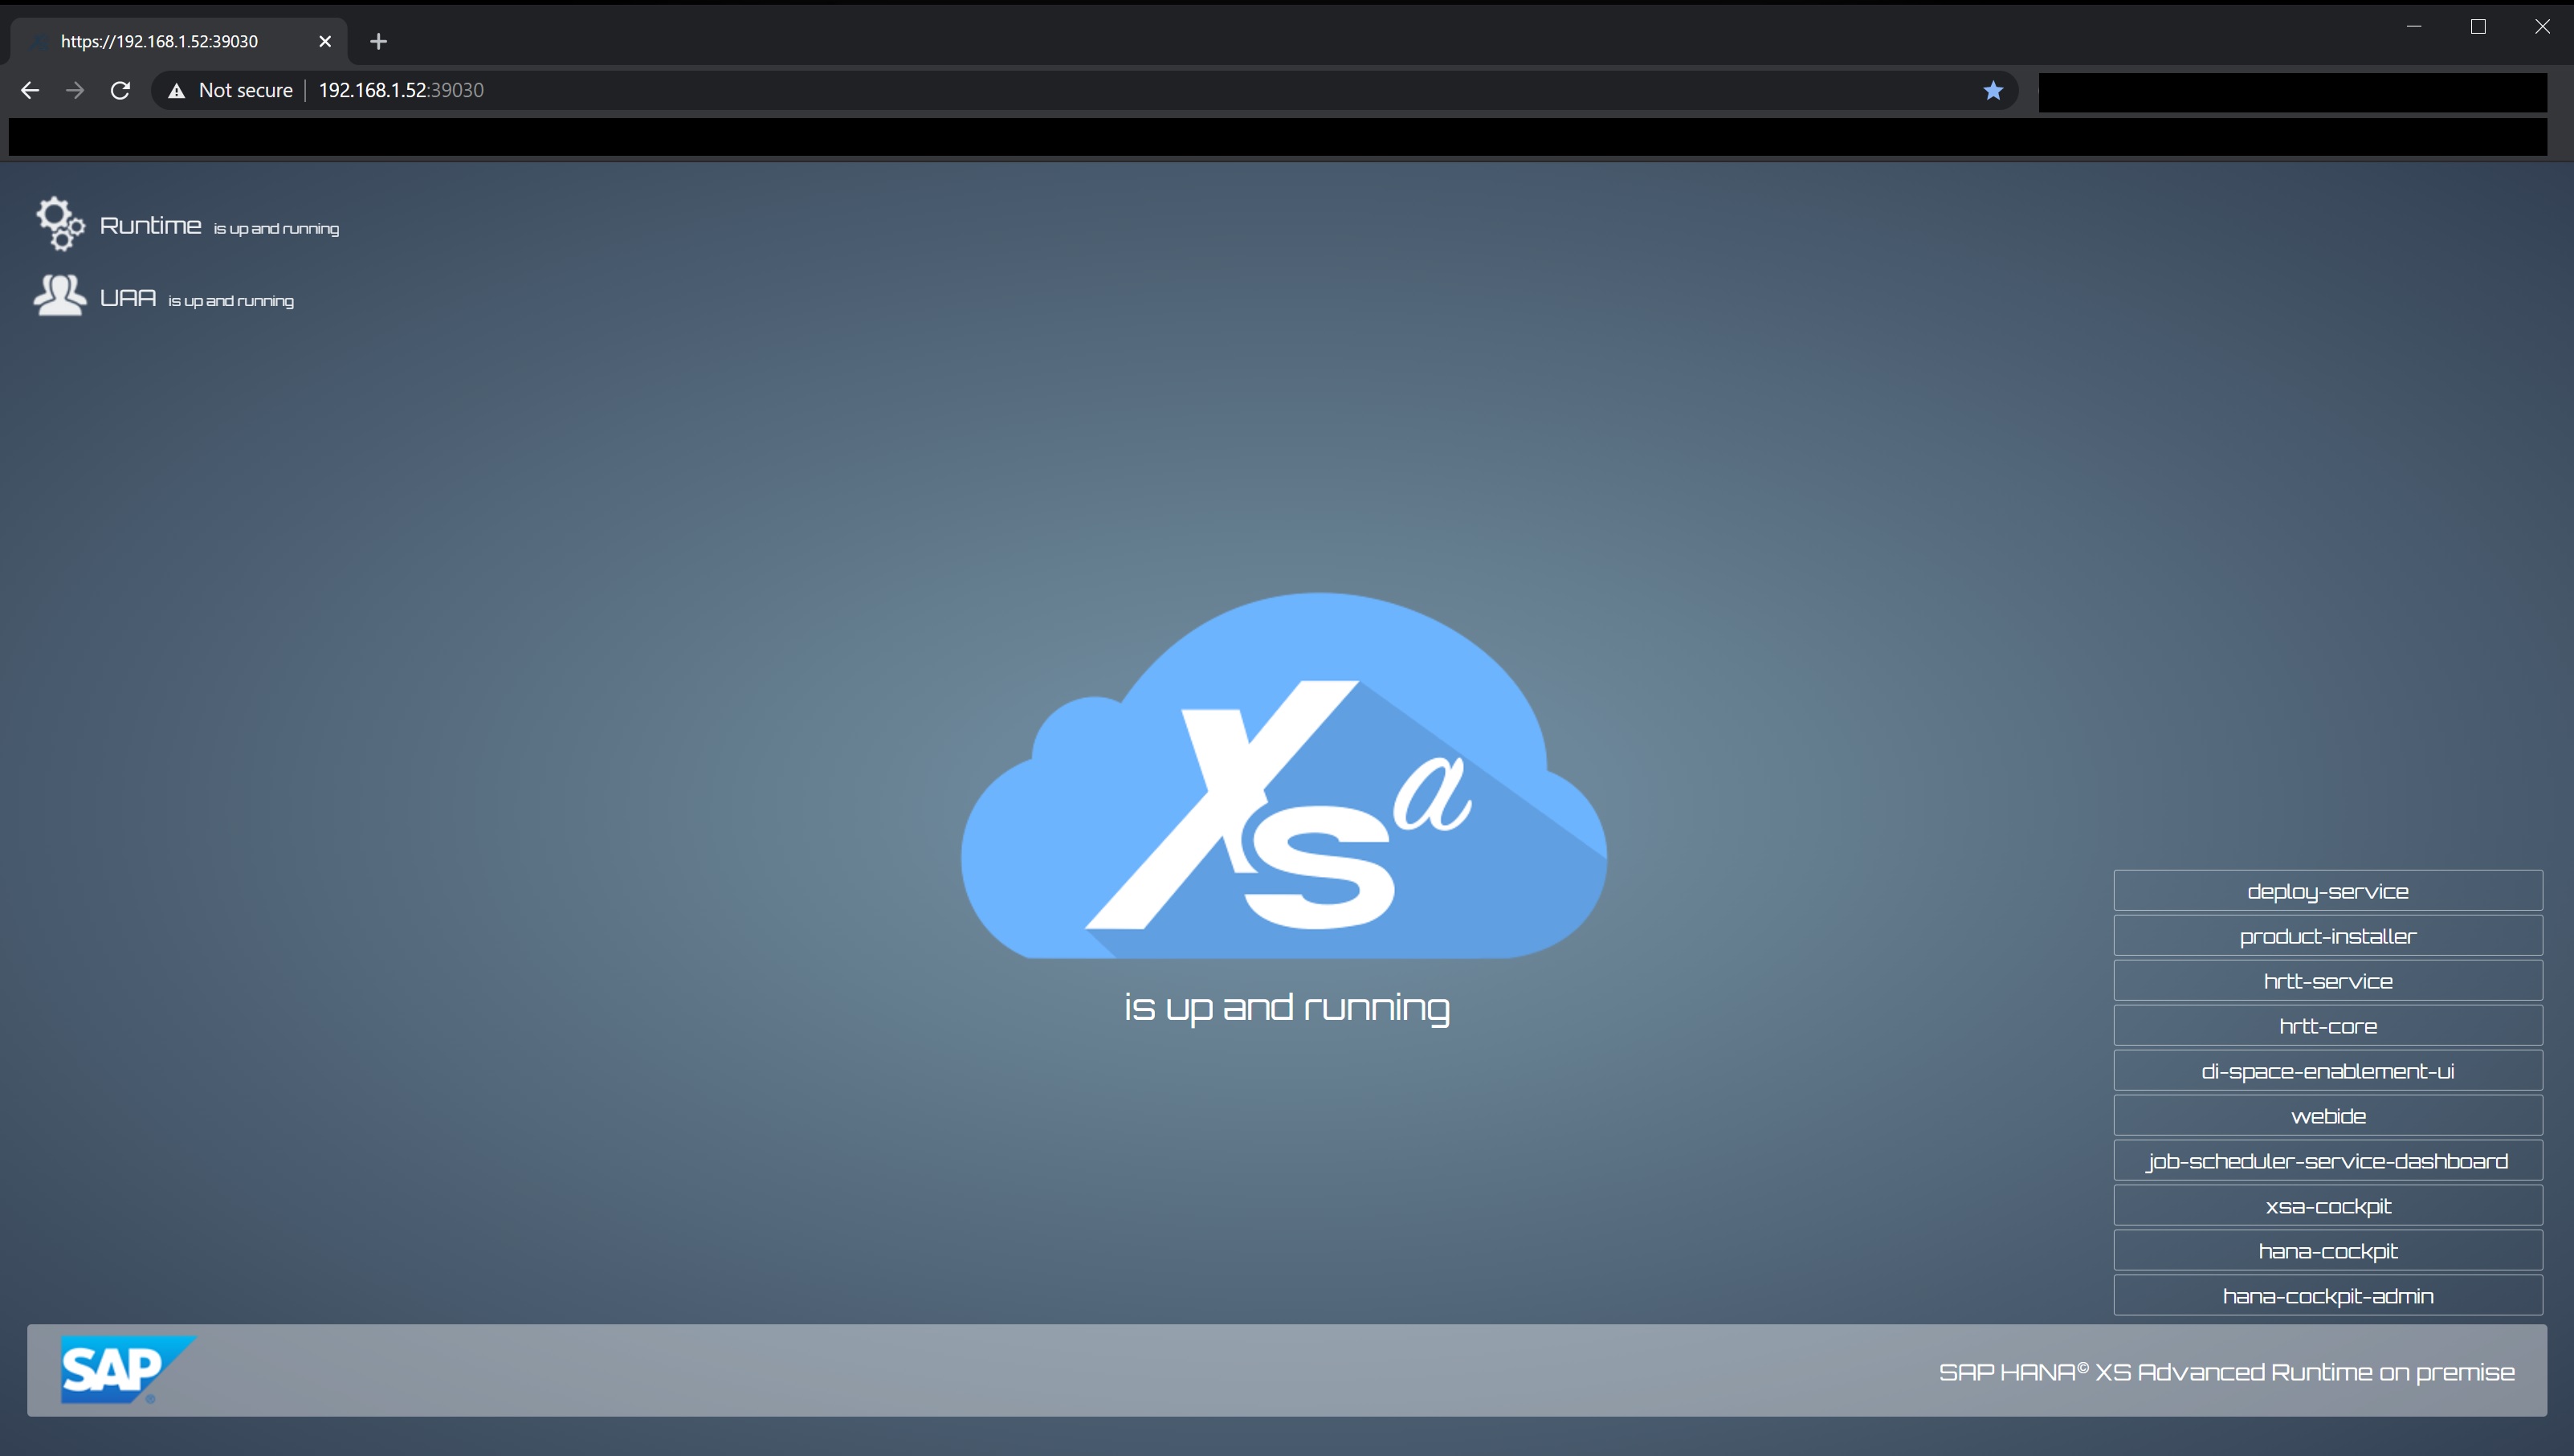
There are a few services that are useful to the administrator, open a browser a point to https://<server IP>:39030 as display in the above command, you are taken to the XS services screen, if you notice in the bottom right-hand corner there are a number of services that we can use (connect to).
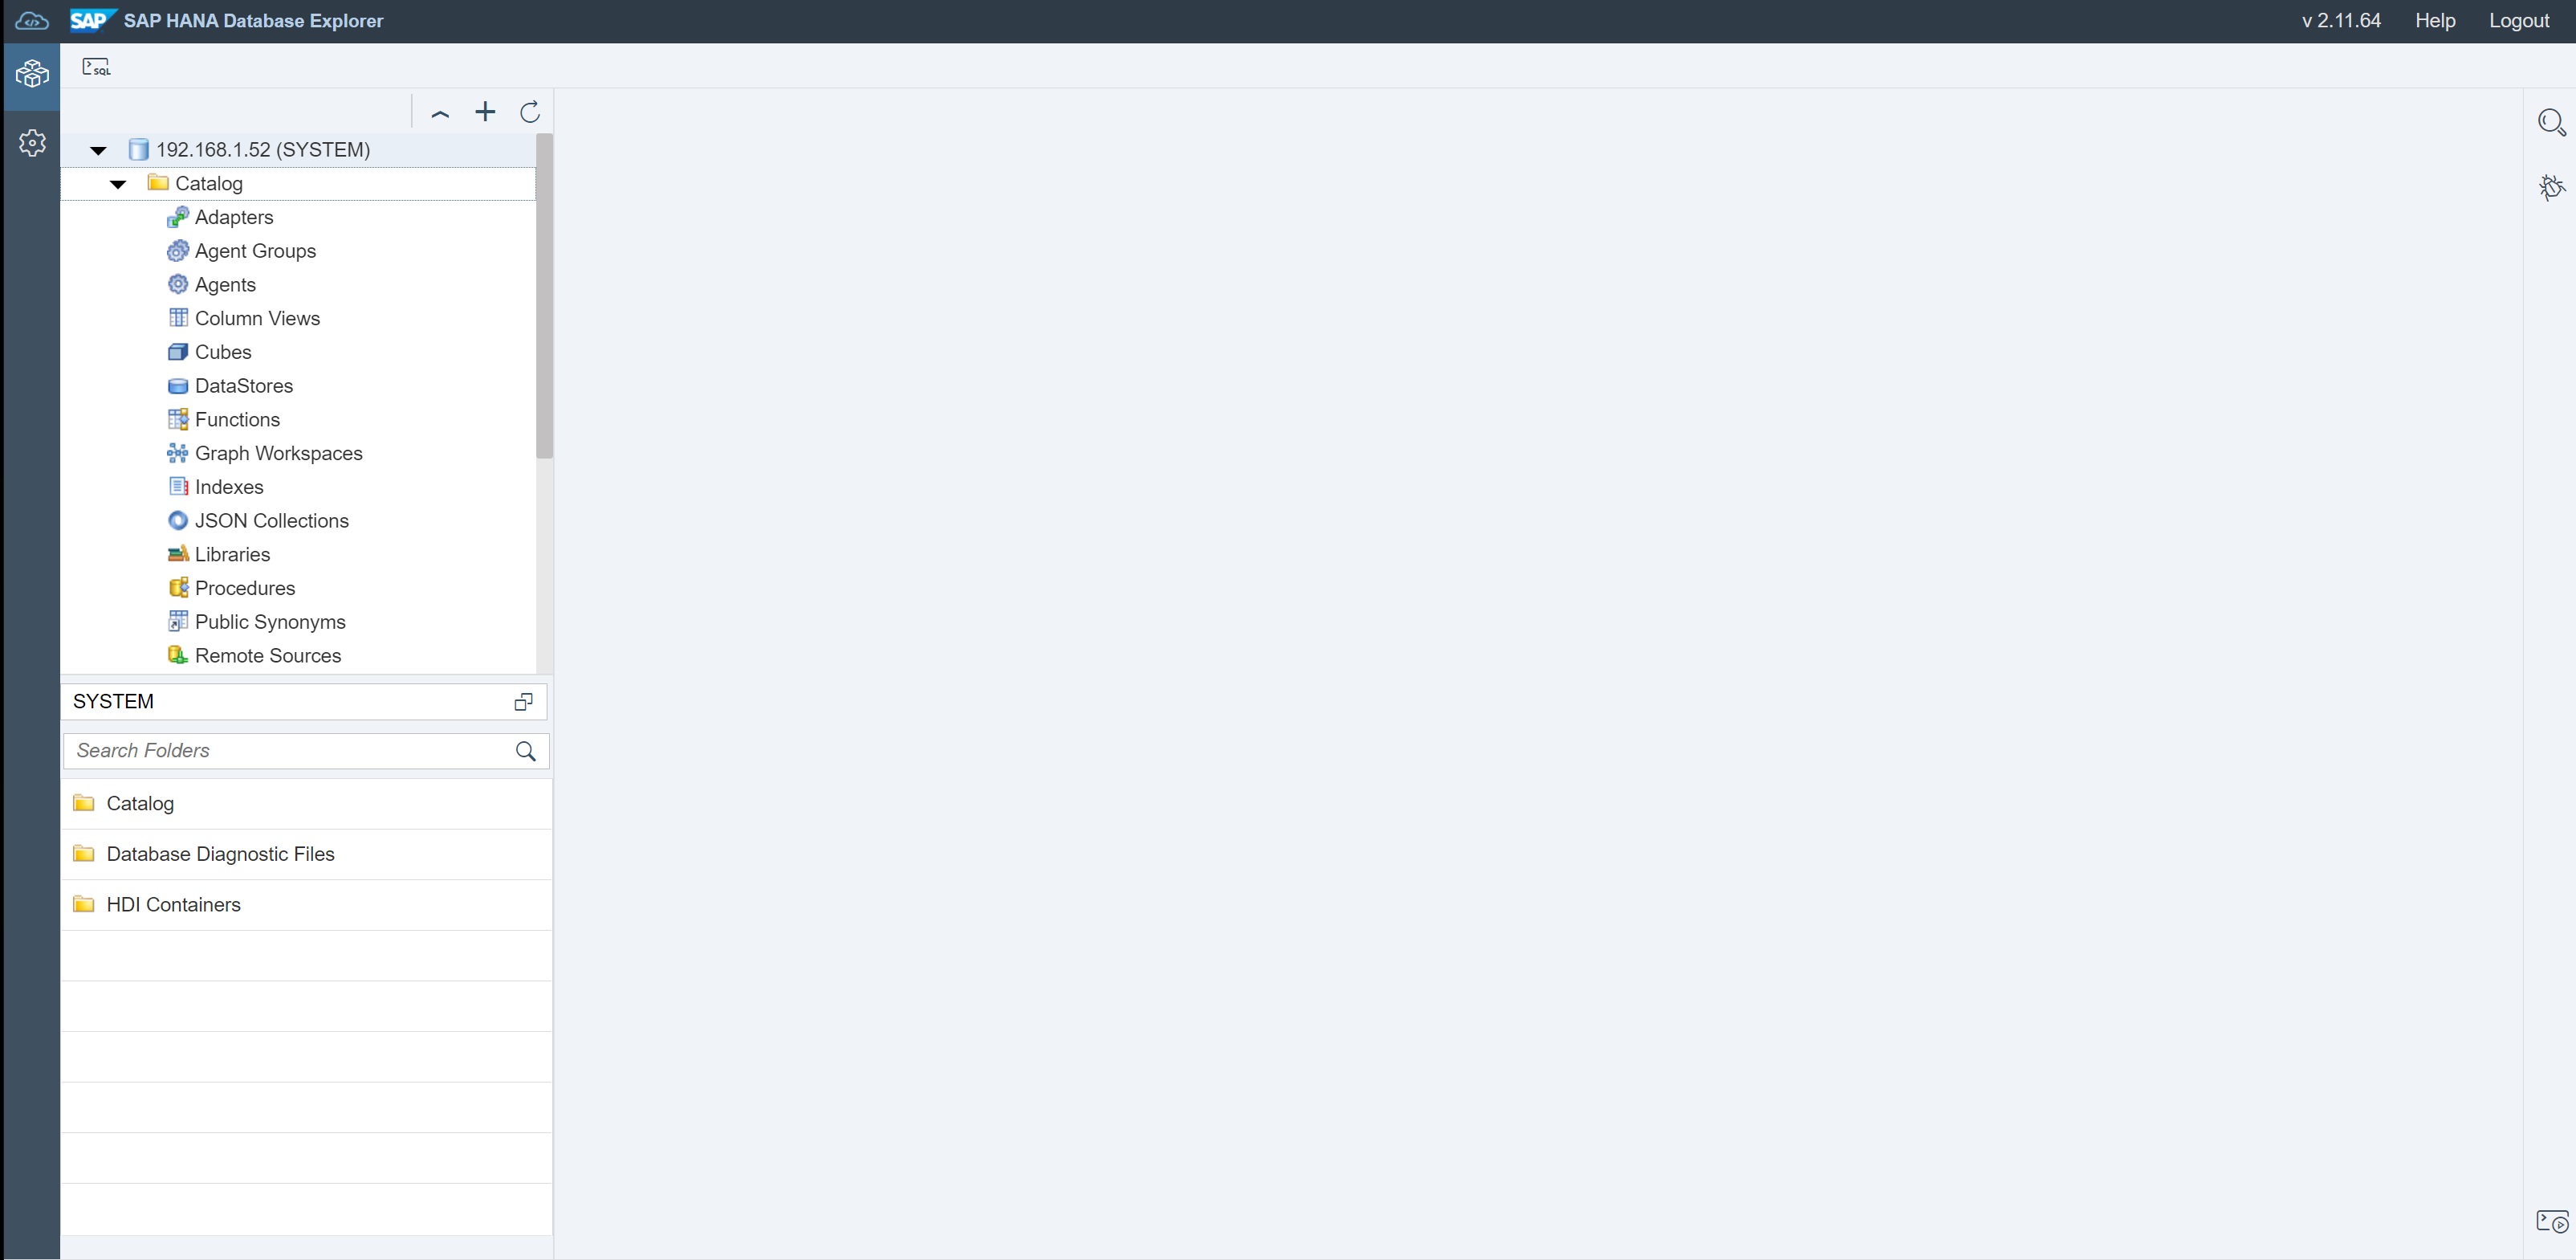
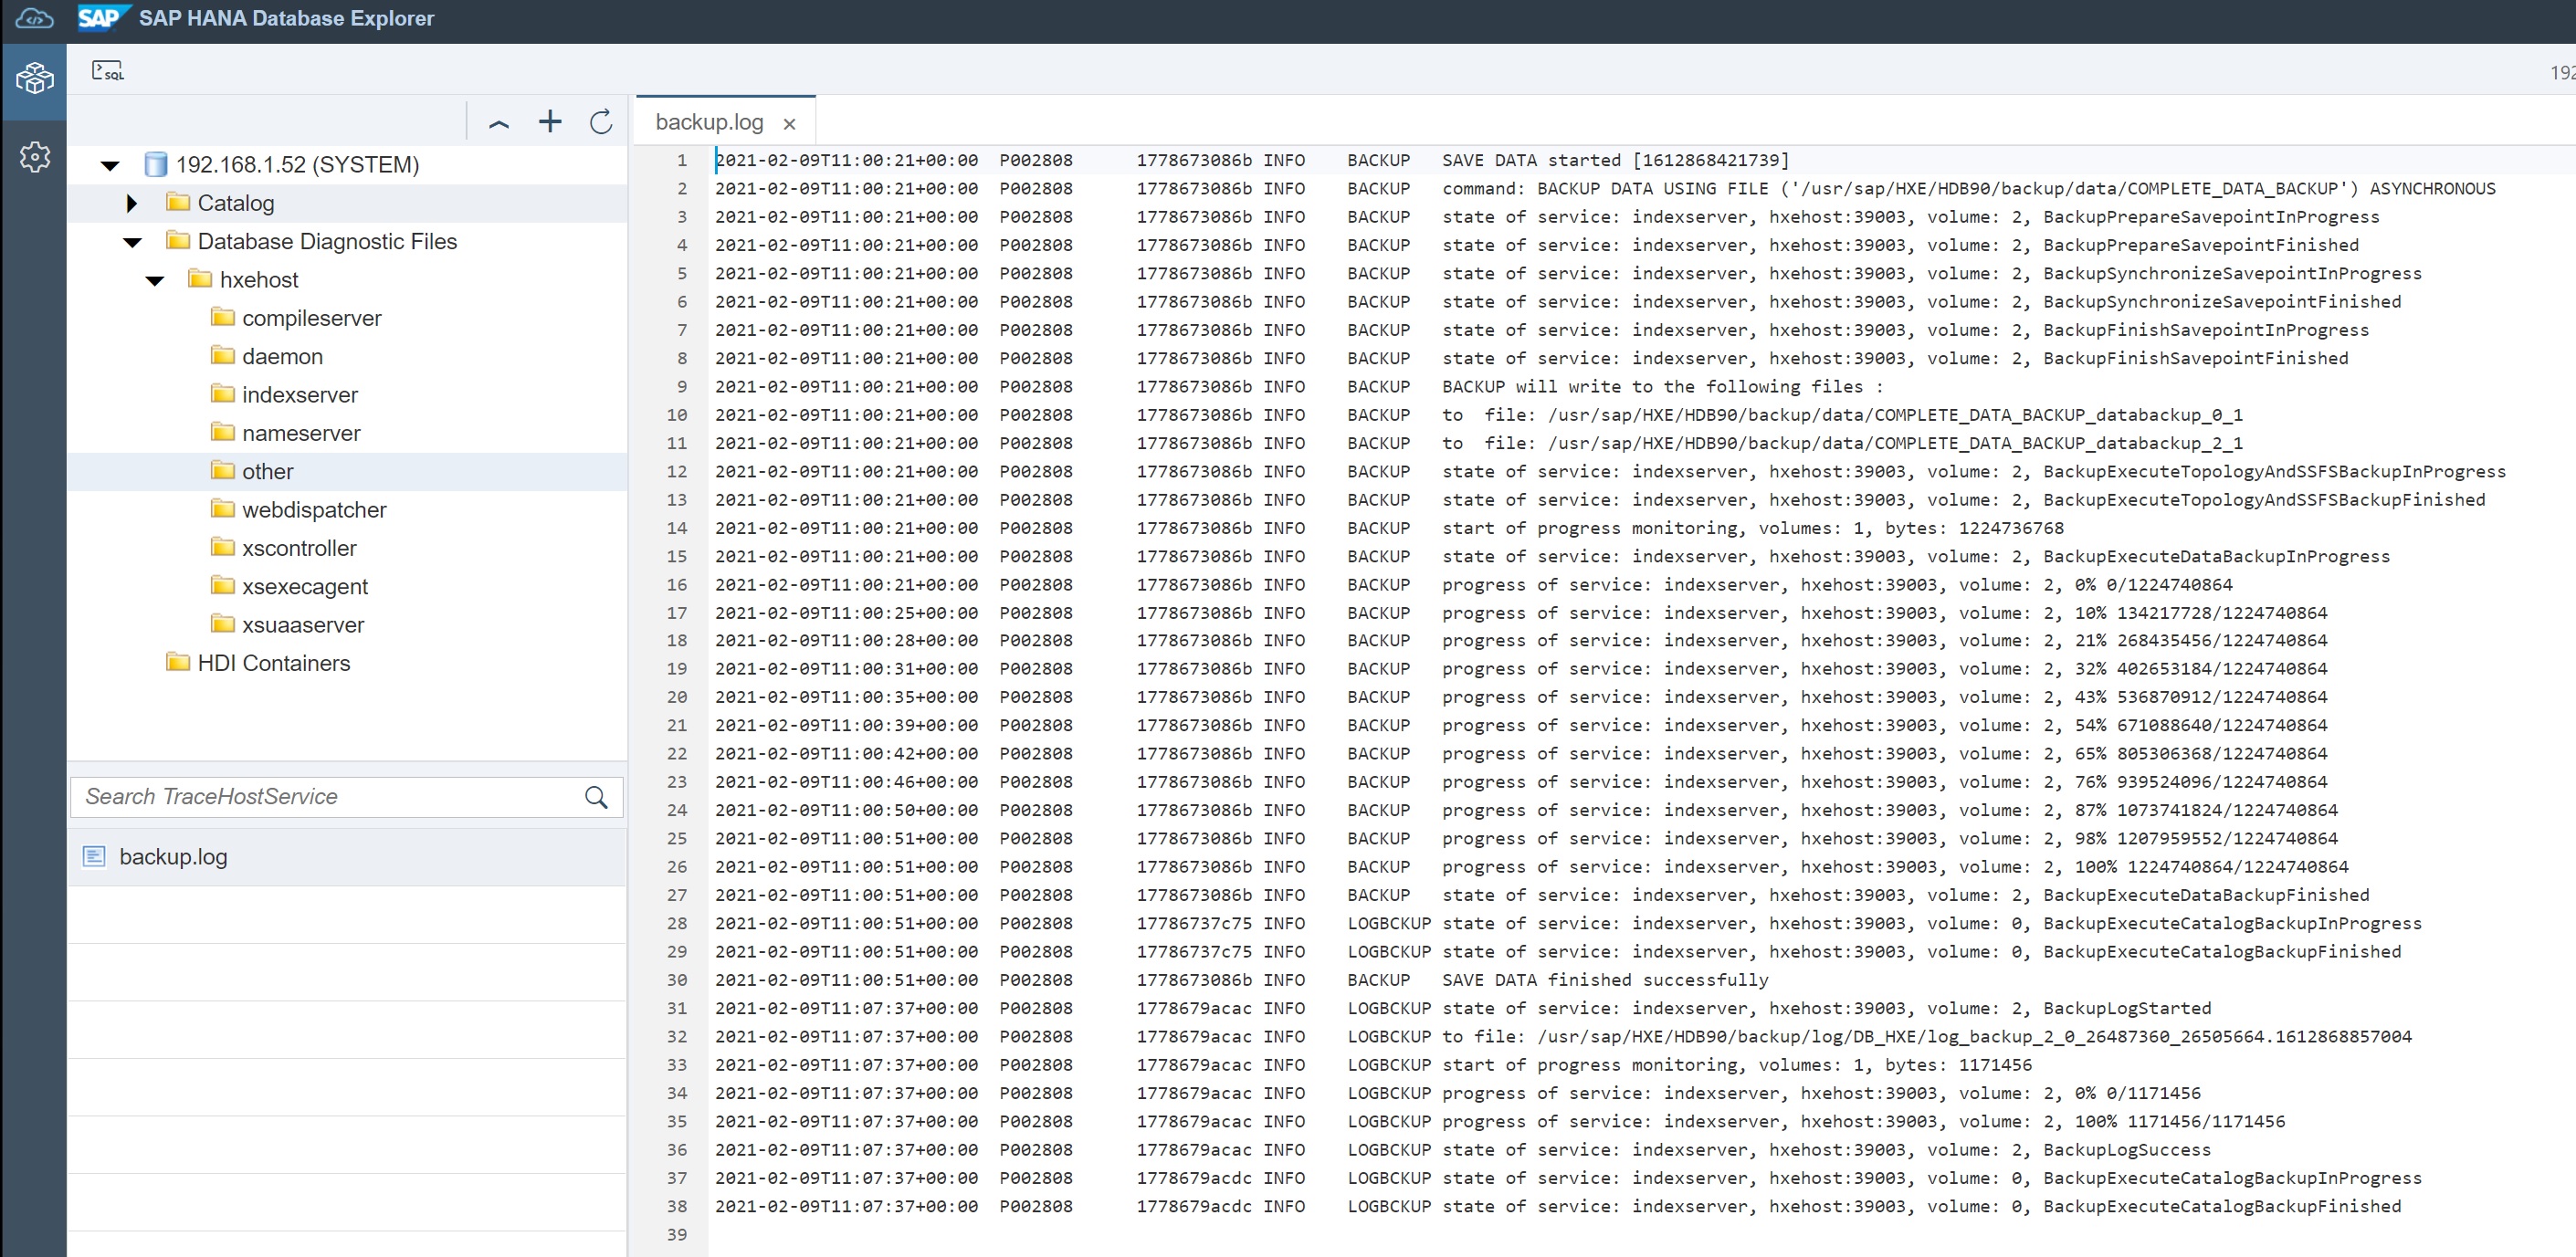
Selecting the hrtt-core takes you to the SAP Hana Database Exporer, you need to register a system, once registered you then have access to a number of information regarding the Hana system.
For example the backup log
Next we look at the xsa-cockpit has information on the system, tenant databases, host and user management.
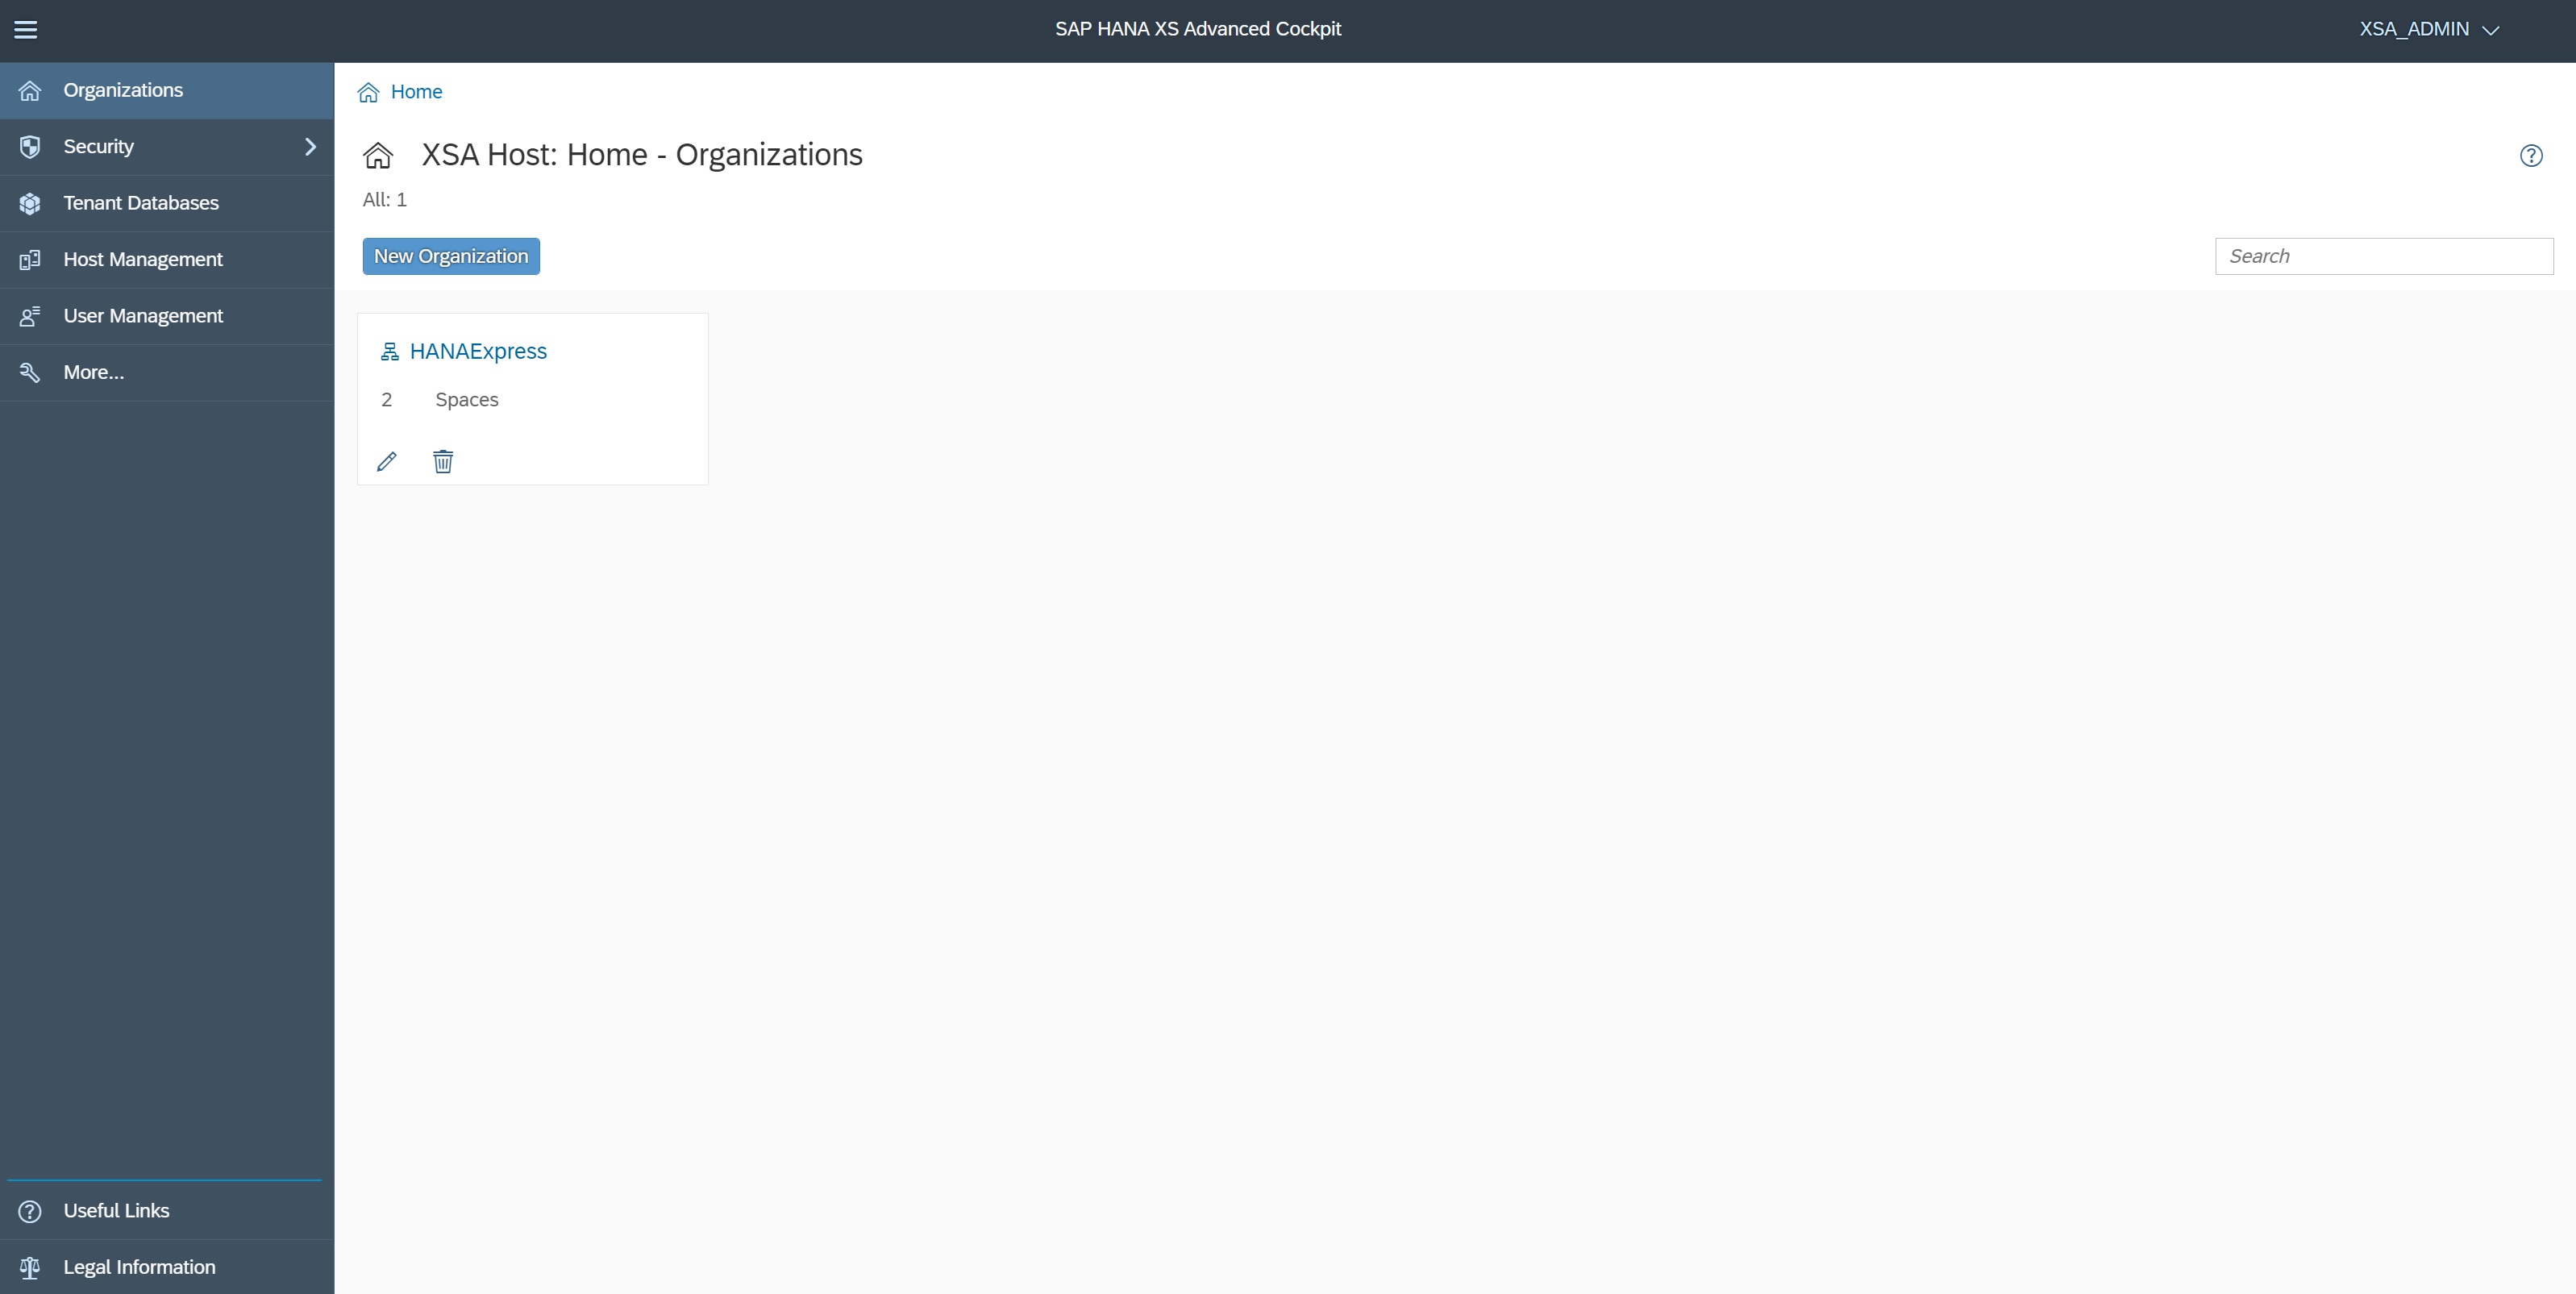
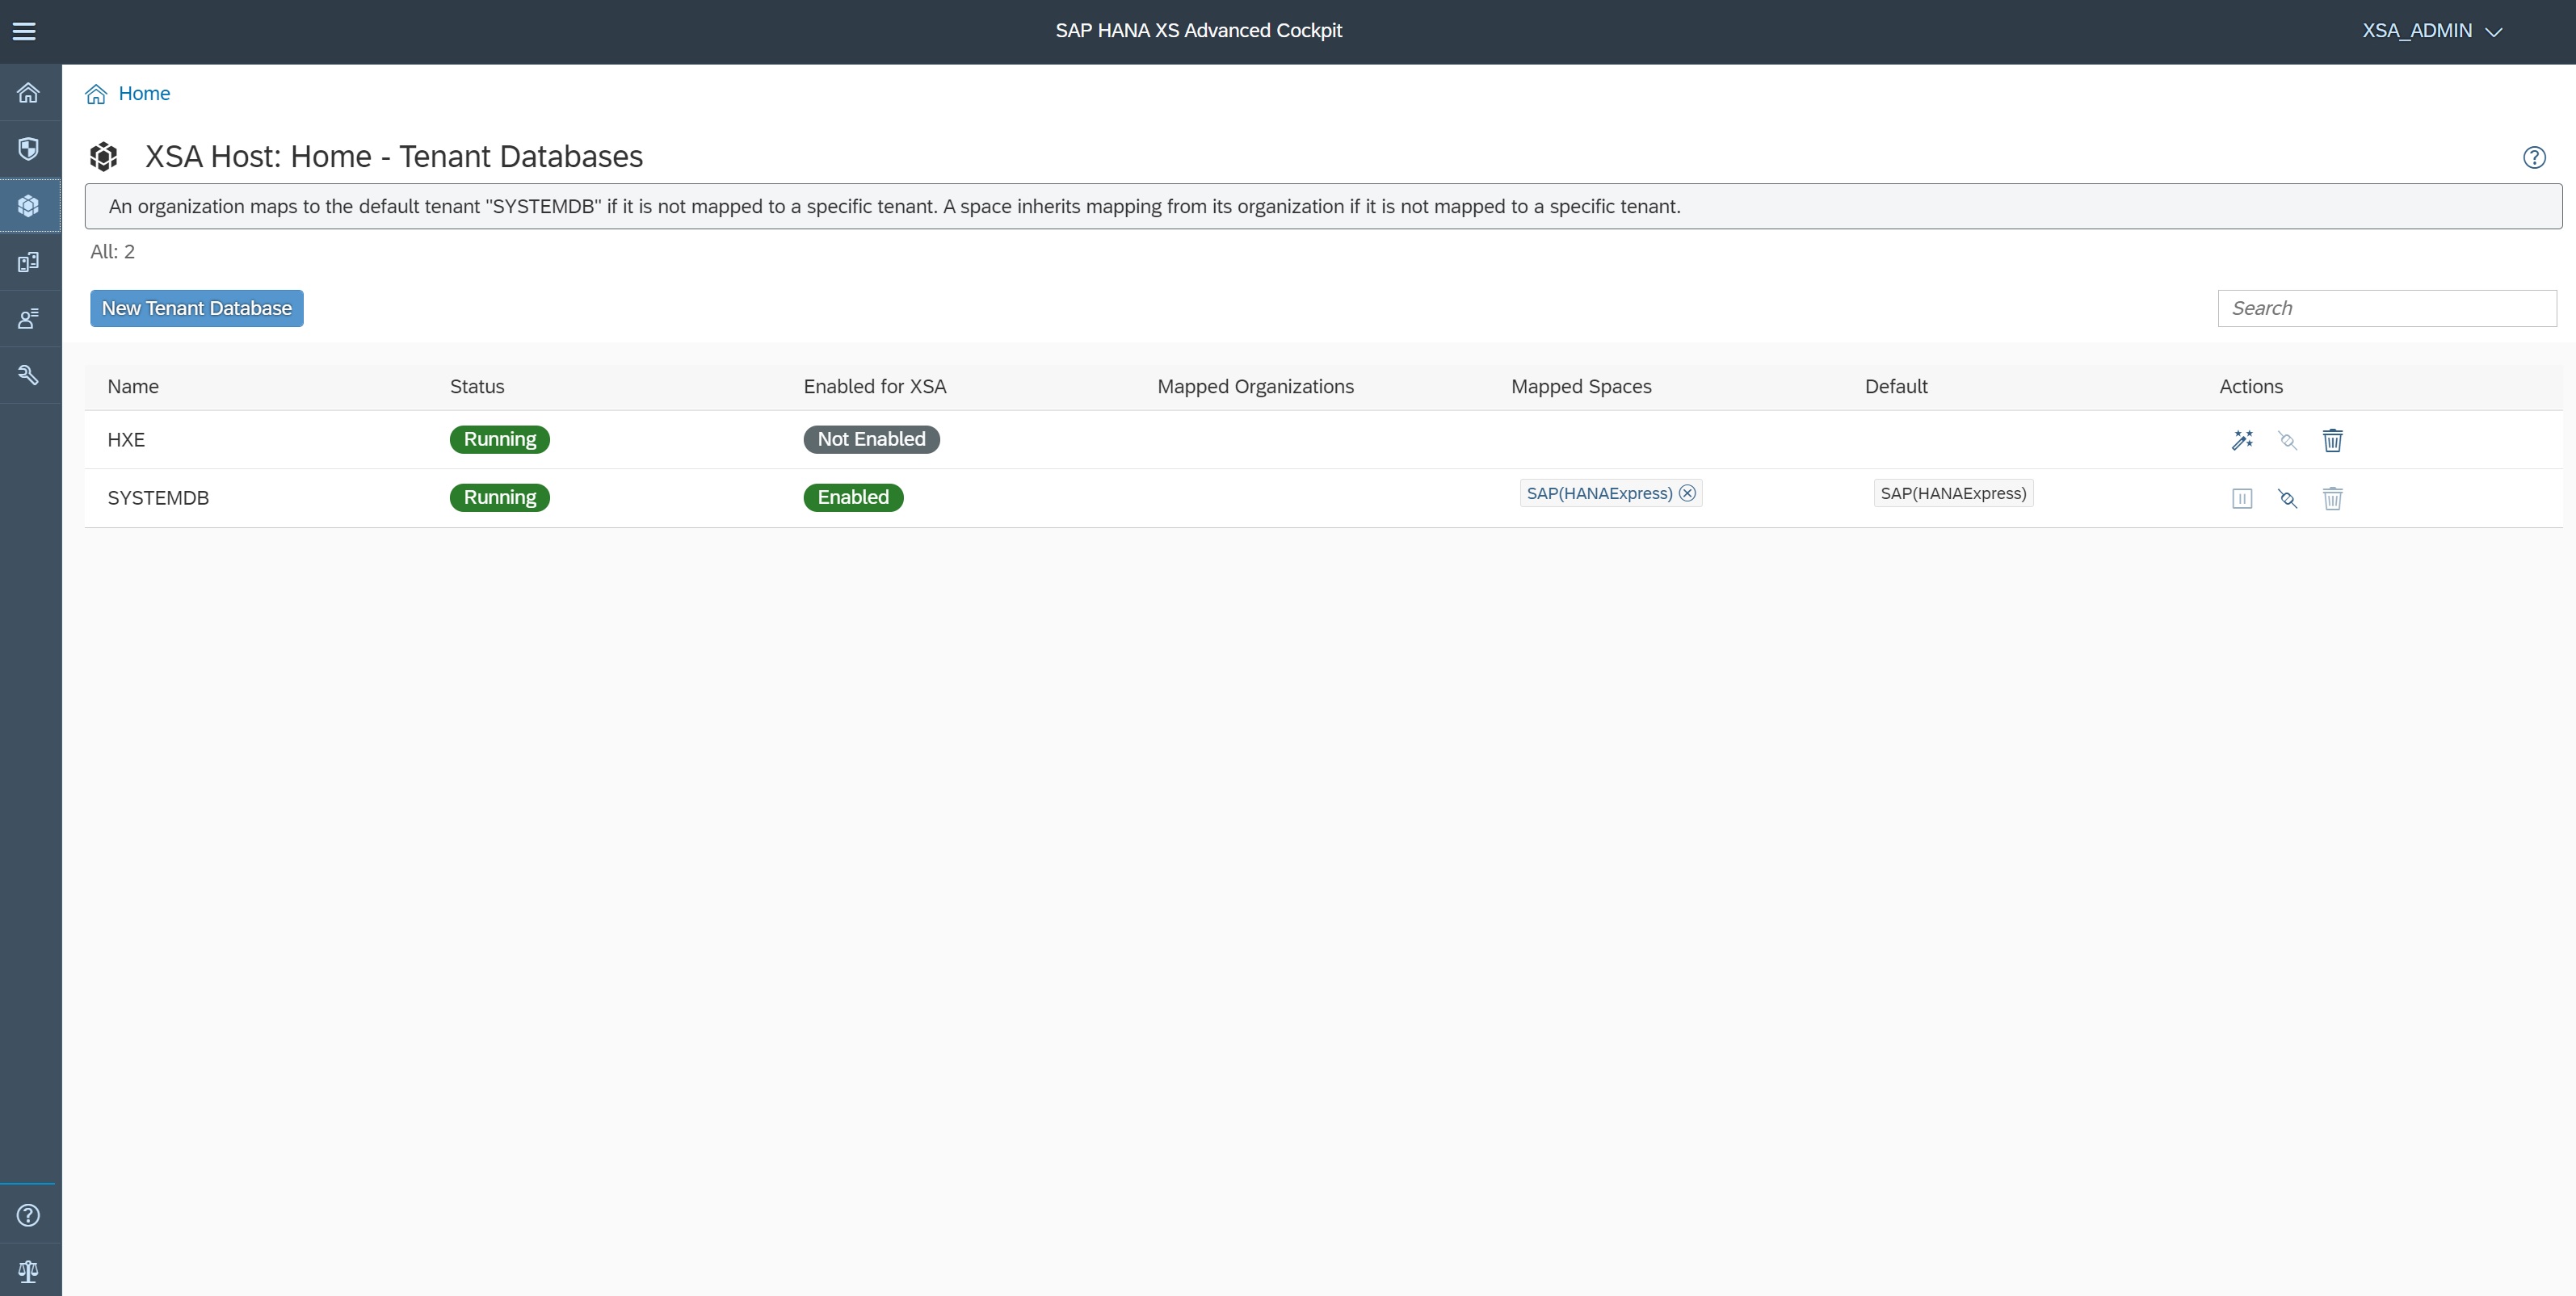
Selecting the tenant databases displays all the tennat database and you can even create one, I will create a section just for tenant databases.
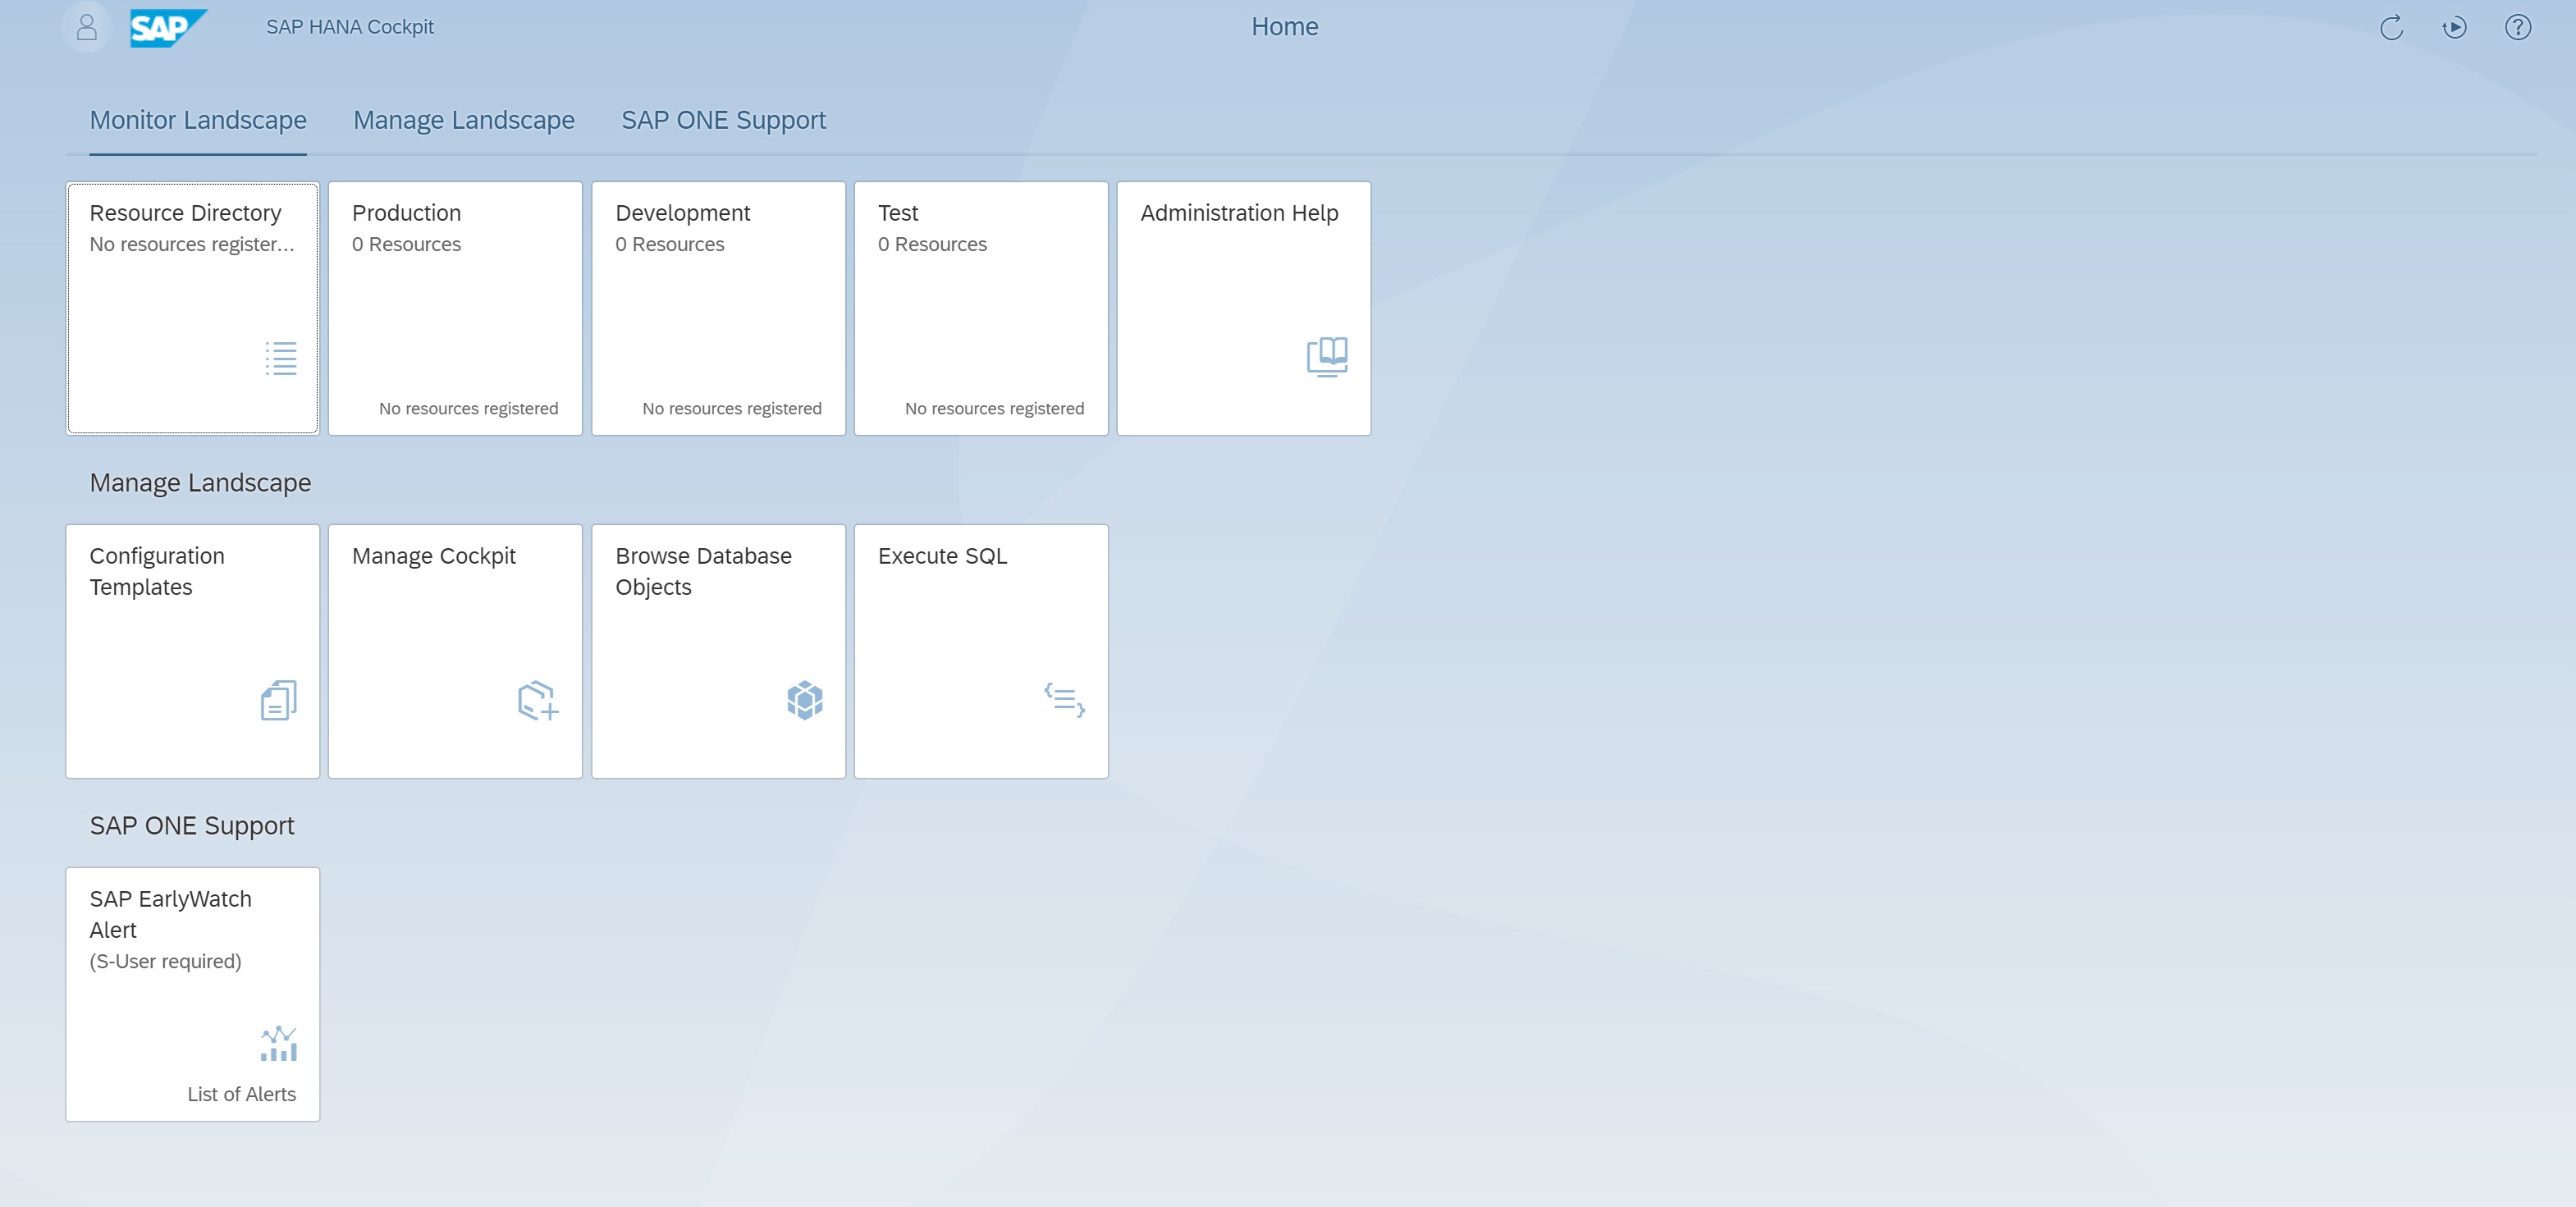
The Hana Cockpit use a fiori screen, here you have many options to view the system, if you notice there are three tabs Monitor landscape, manage landscape and SAP One support. Each of the tabs takes you to the specific fiori apps.
You need to register a system which I have done, then you have access to all sorts of information
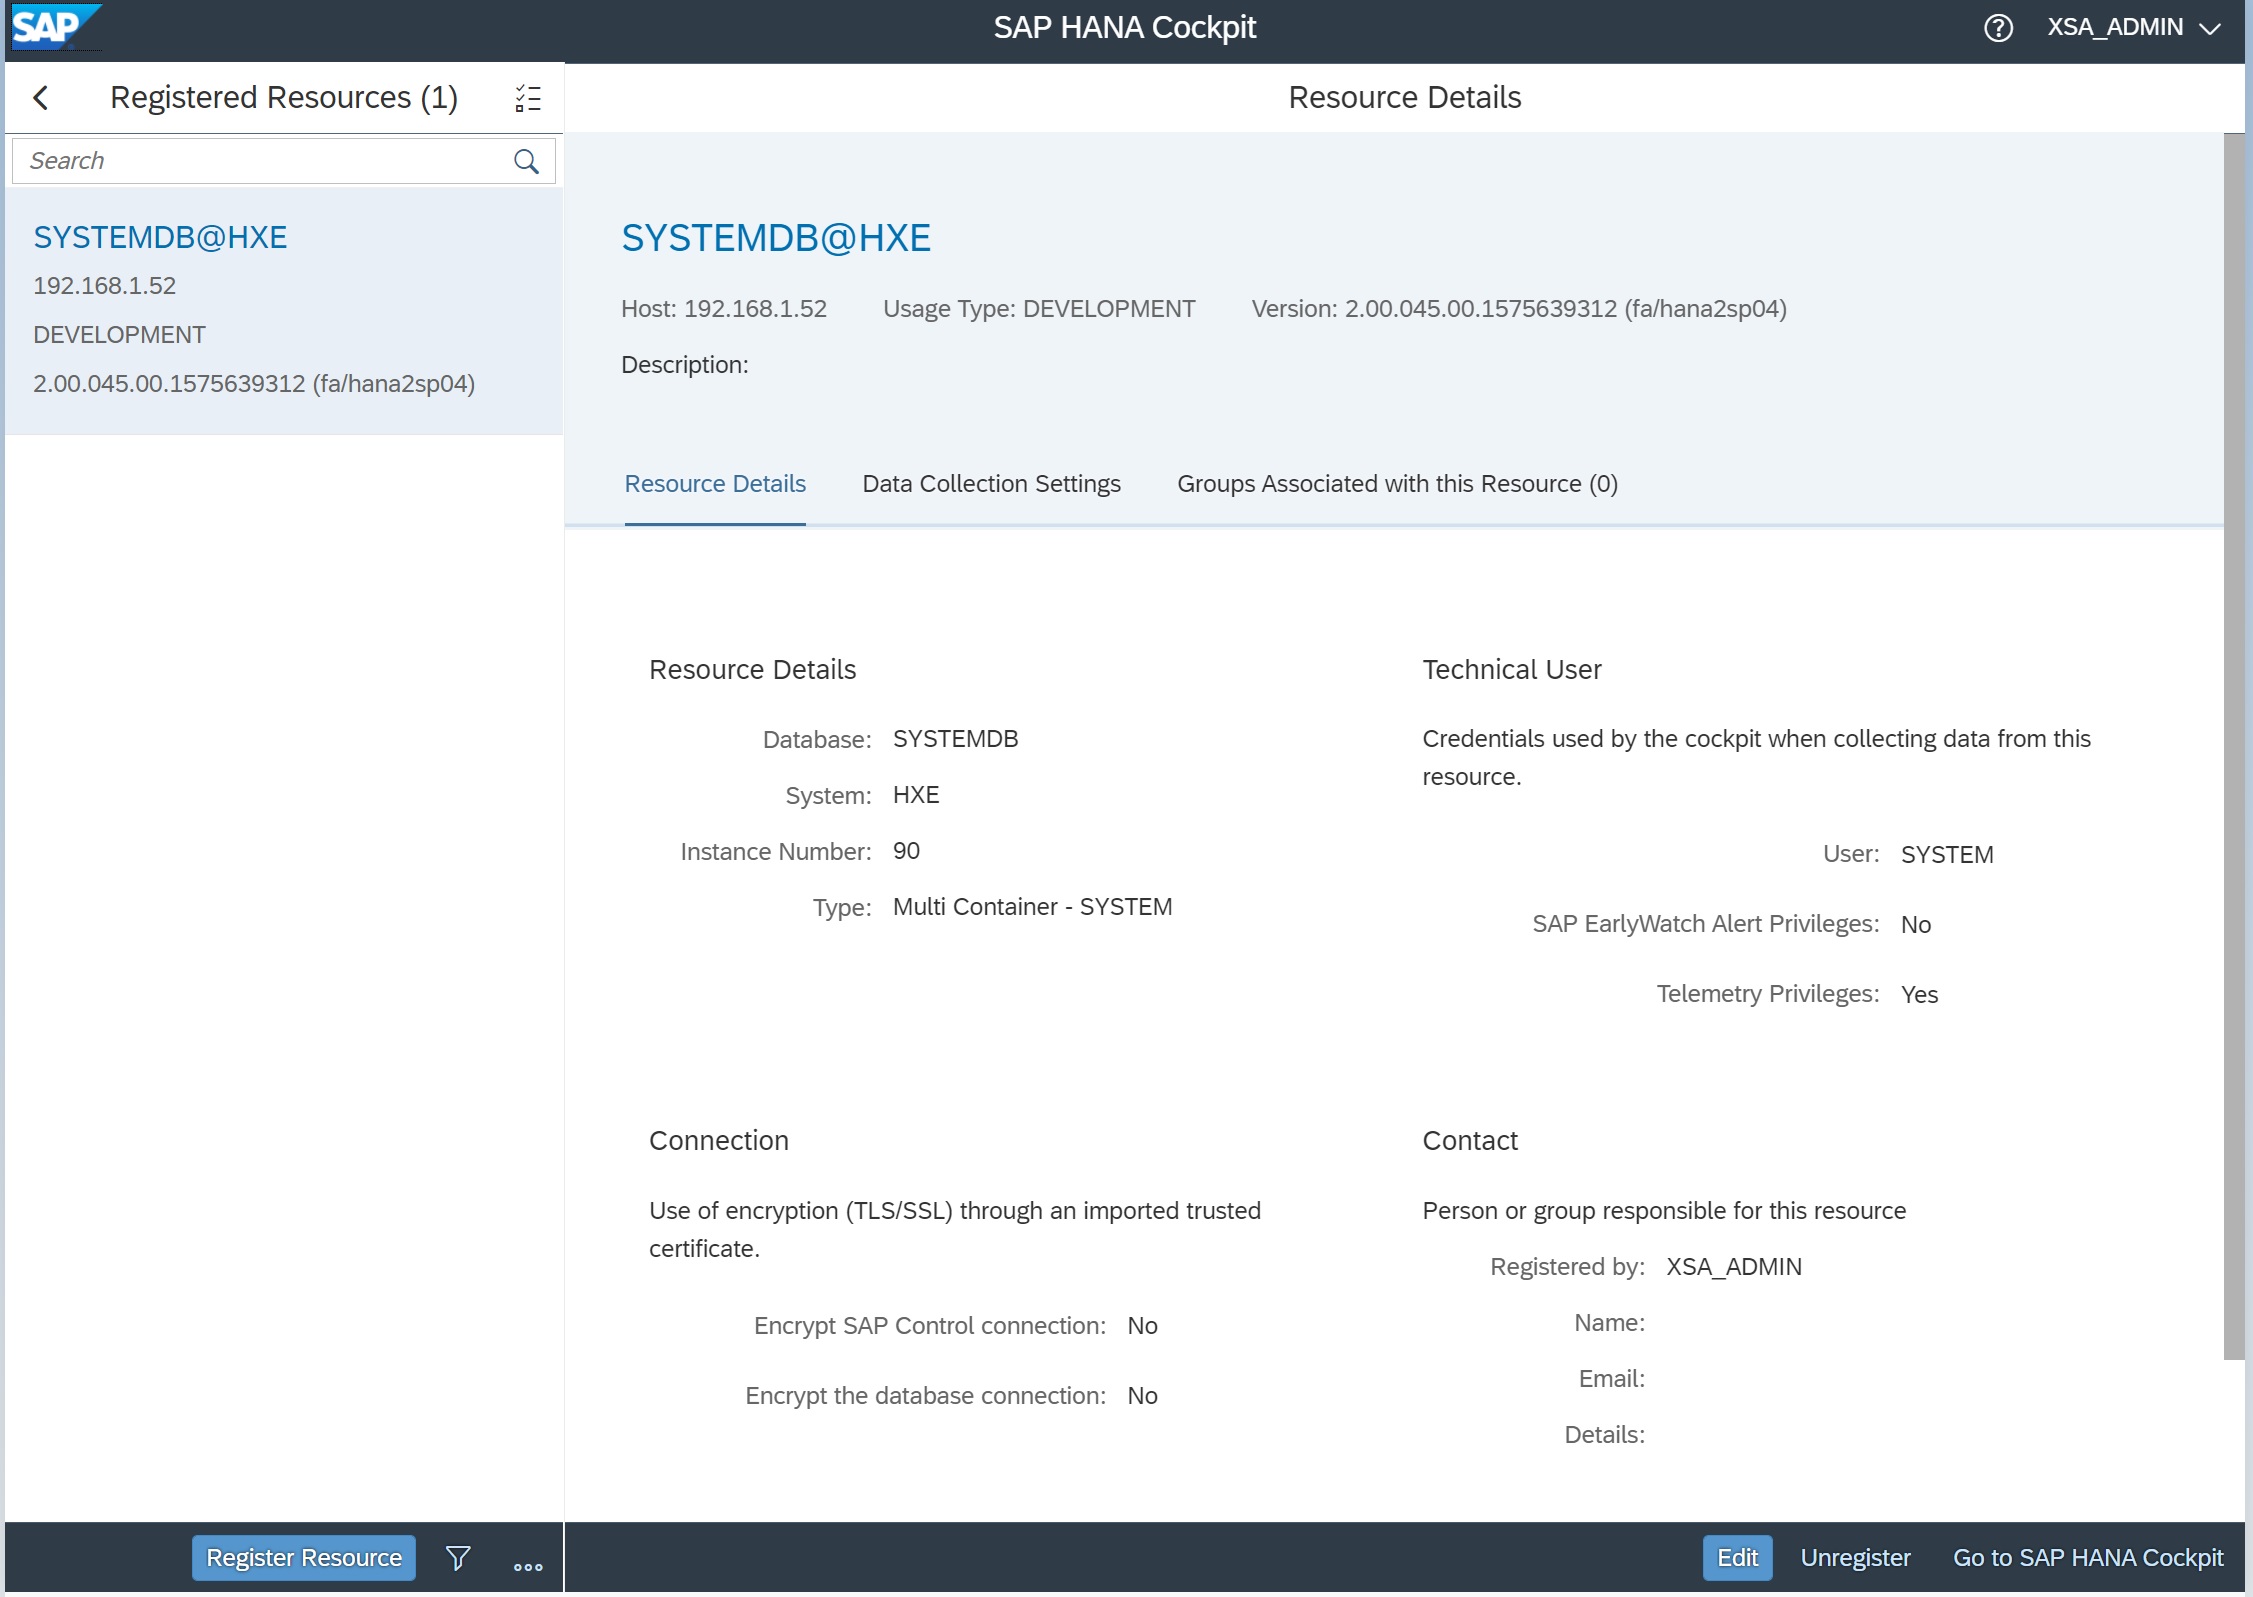
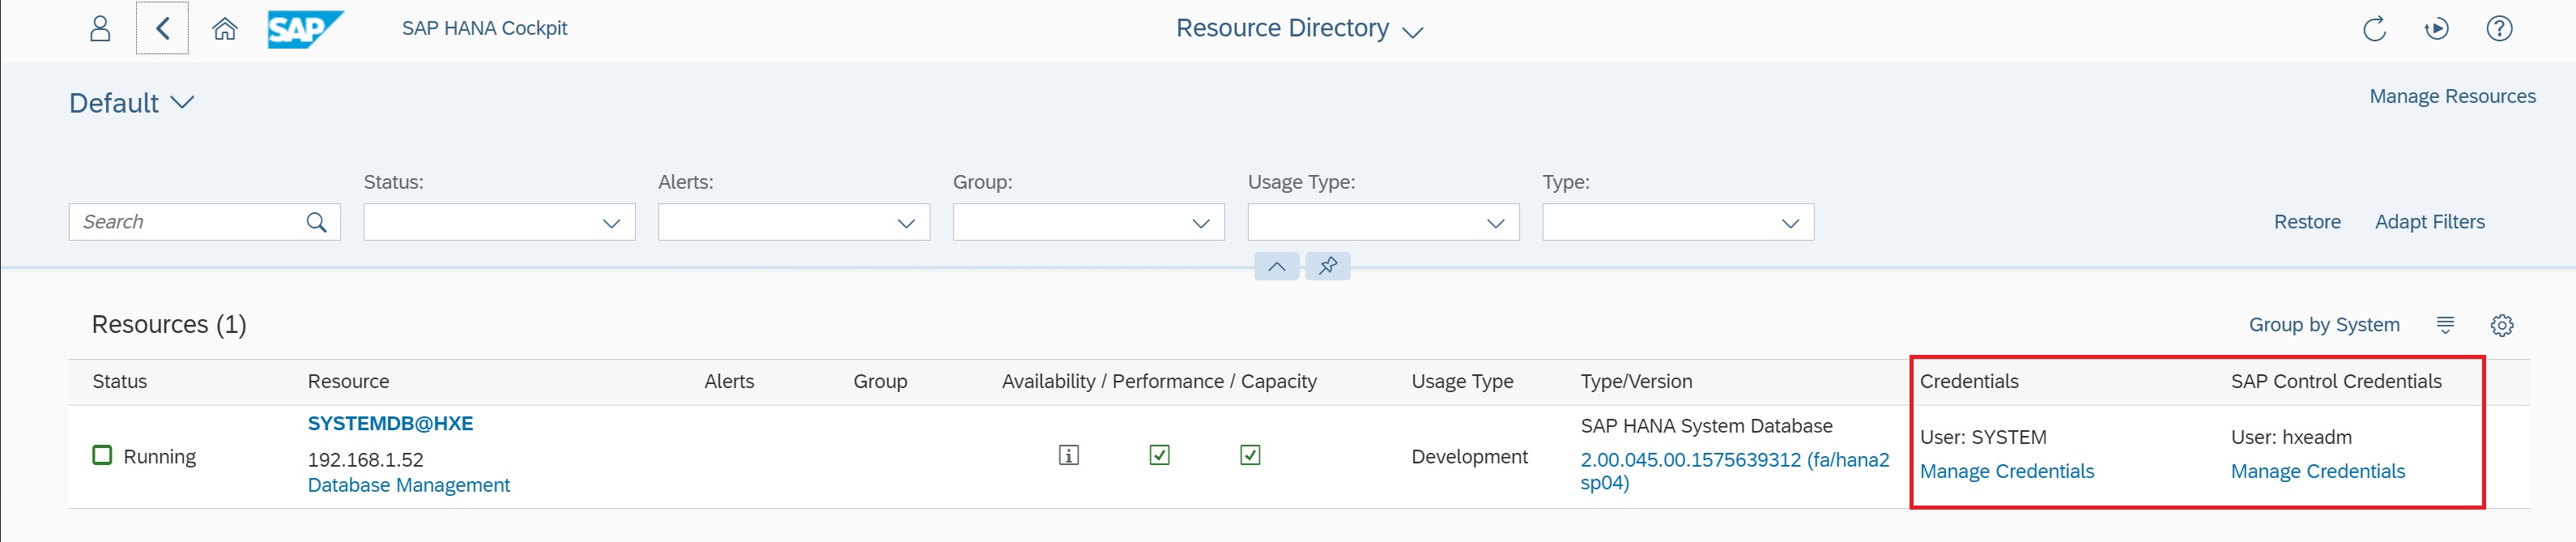
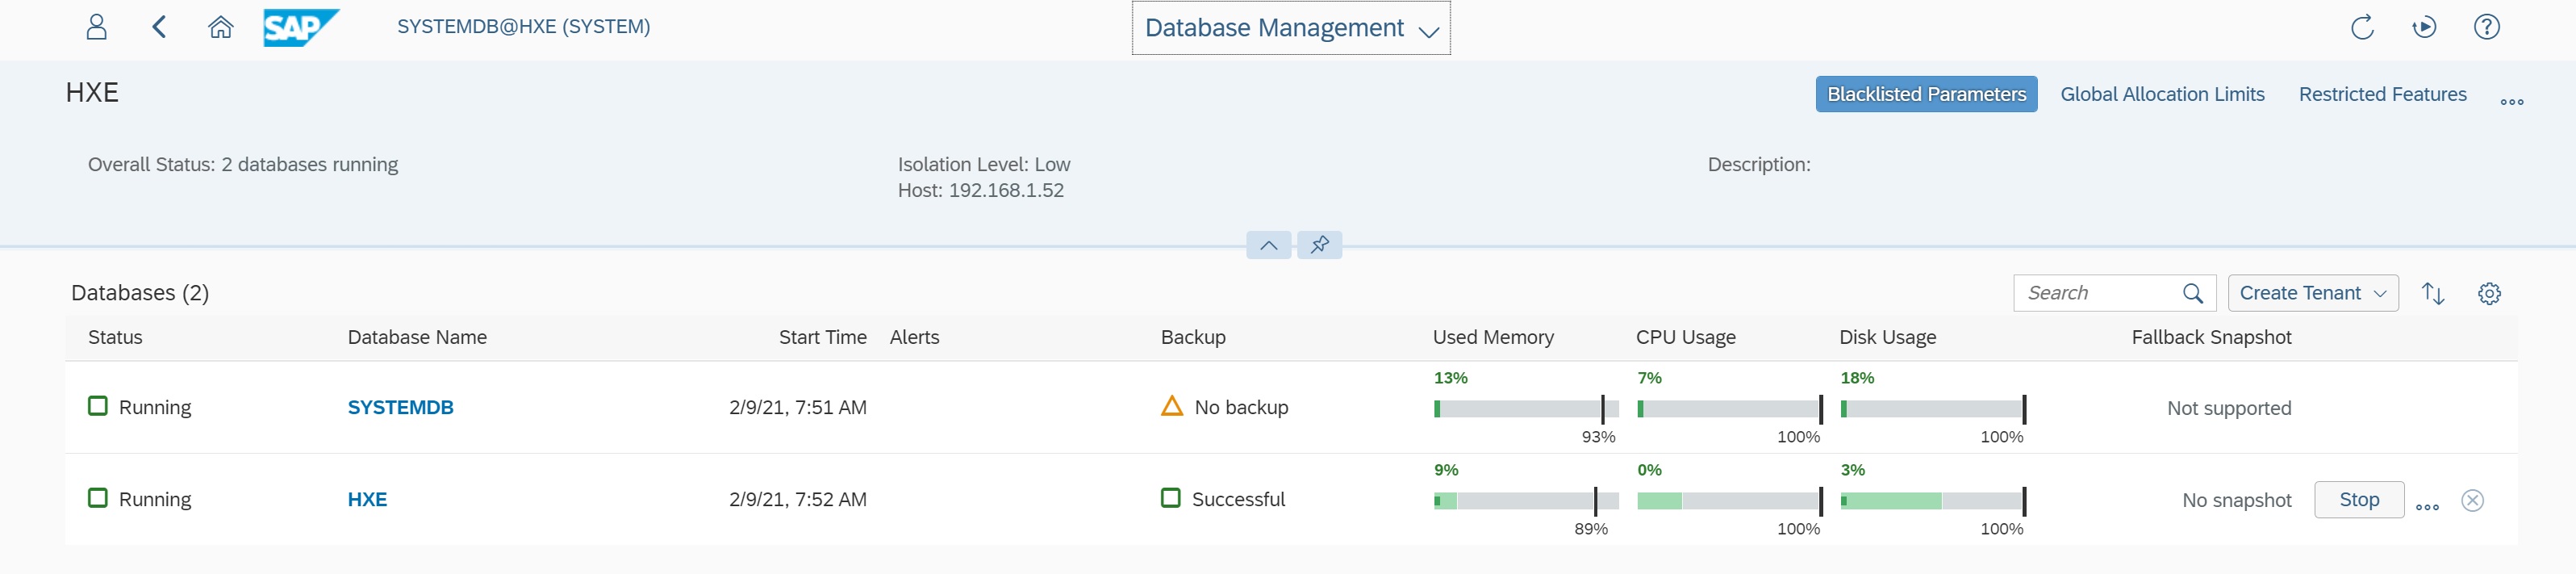
Clicking on the SYSTEMDB@HXE link takes you to the database management screen, there are many areas you can select here, first create the credentials and SAP control credentials
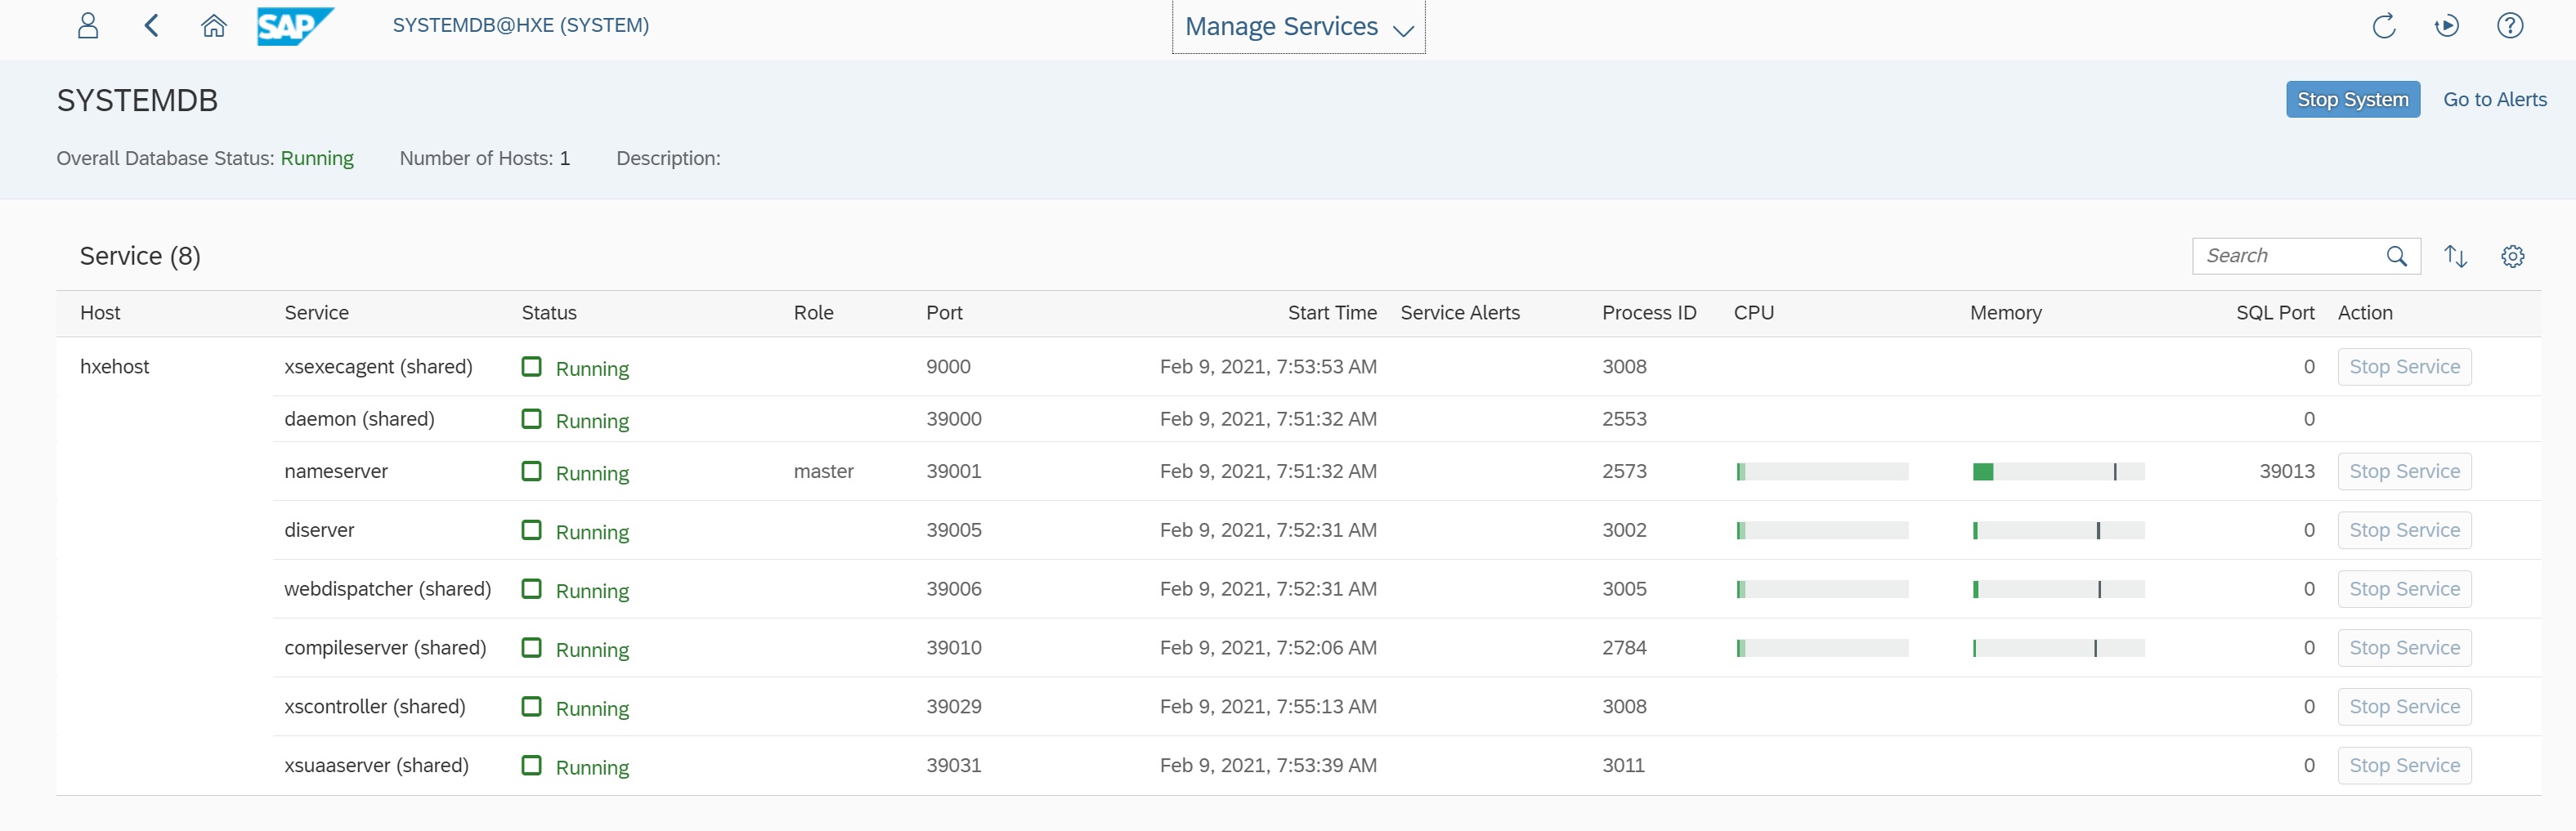
If you click on the running icon you are taken to a list of running processes
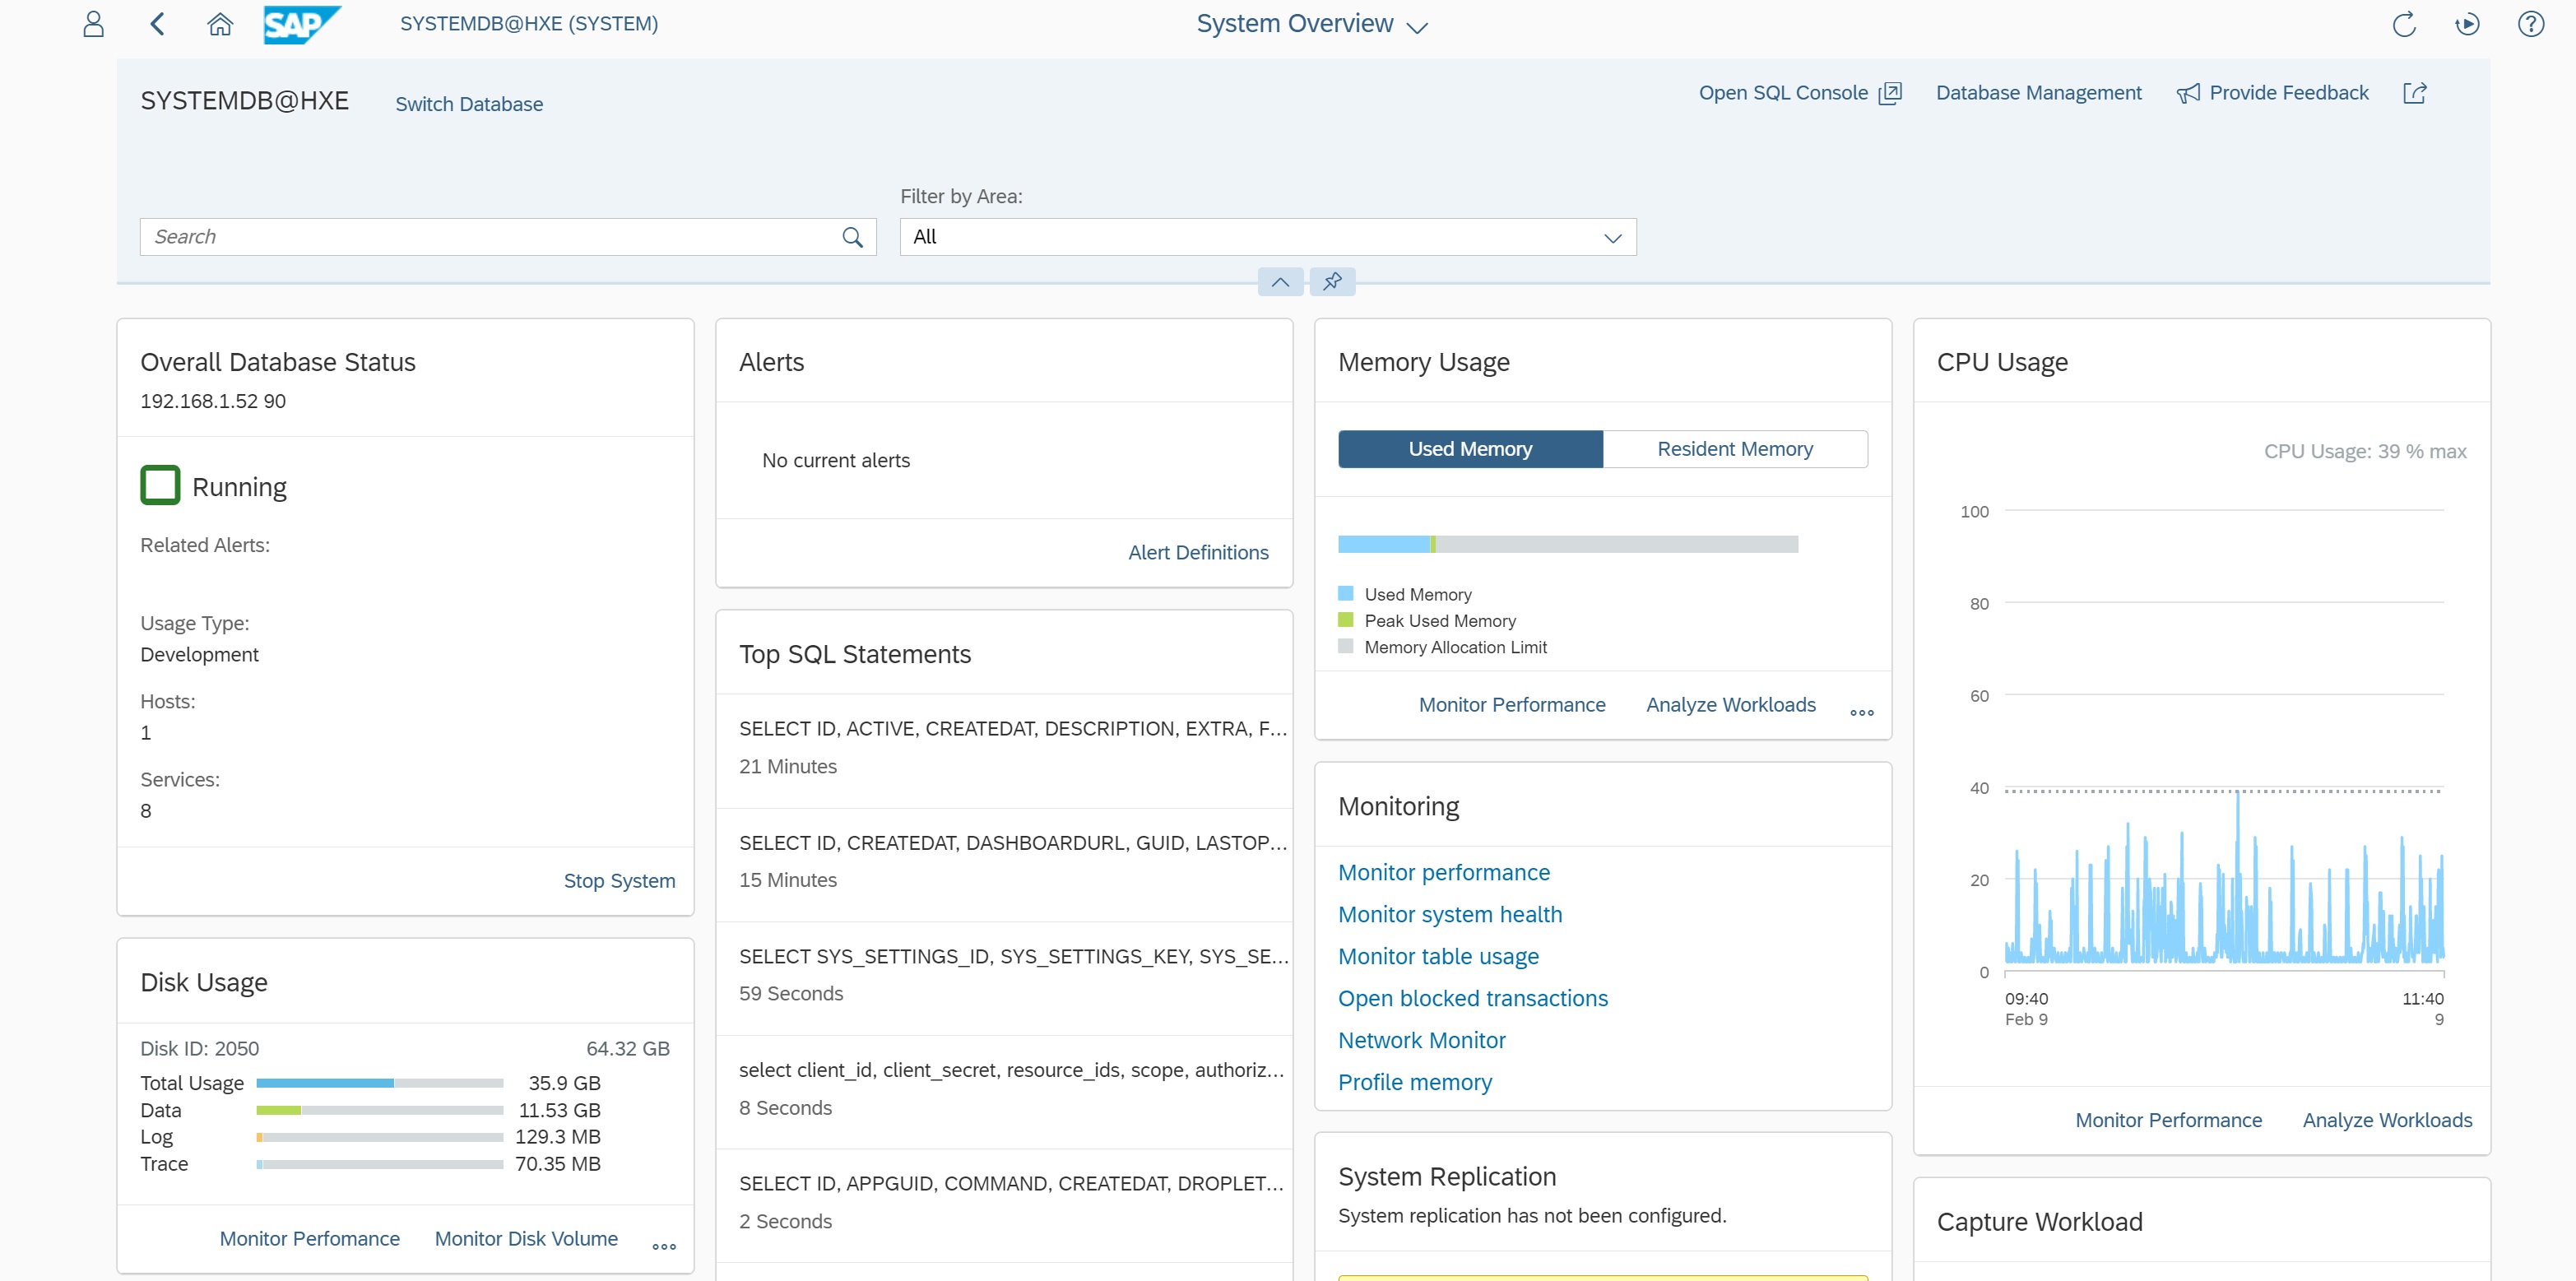
If you click on the systemdb@hxe icon you are taken to a screen that displays vasts amount of information regarding the database
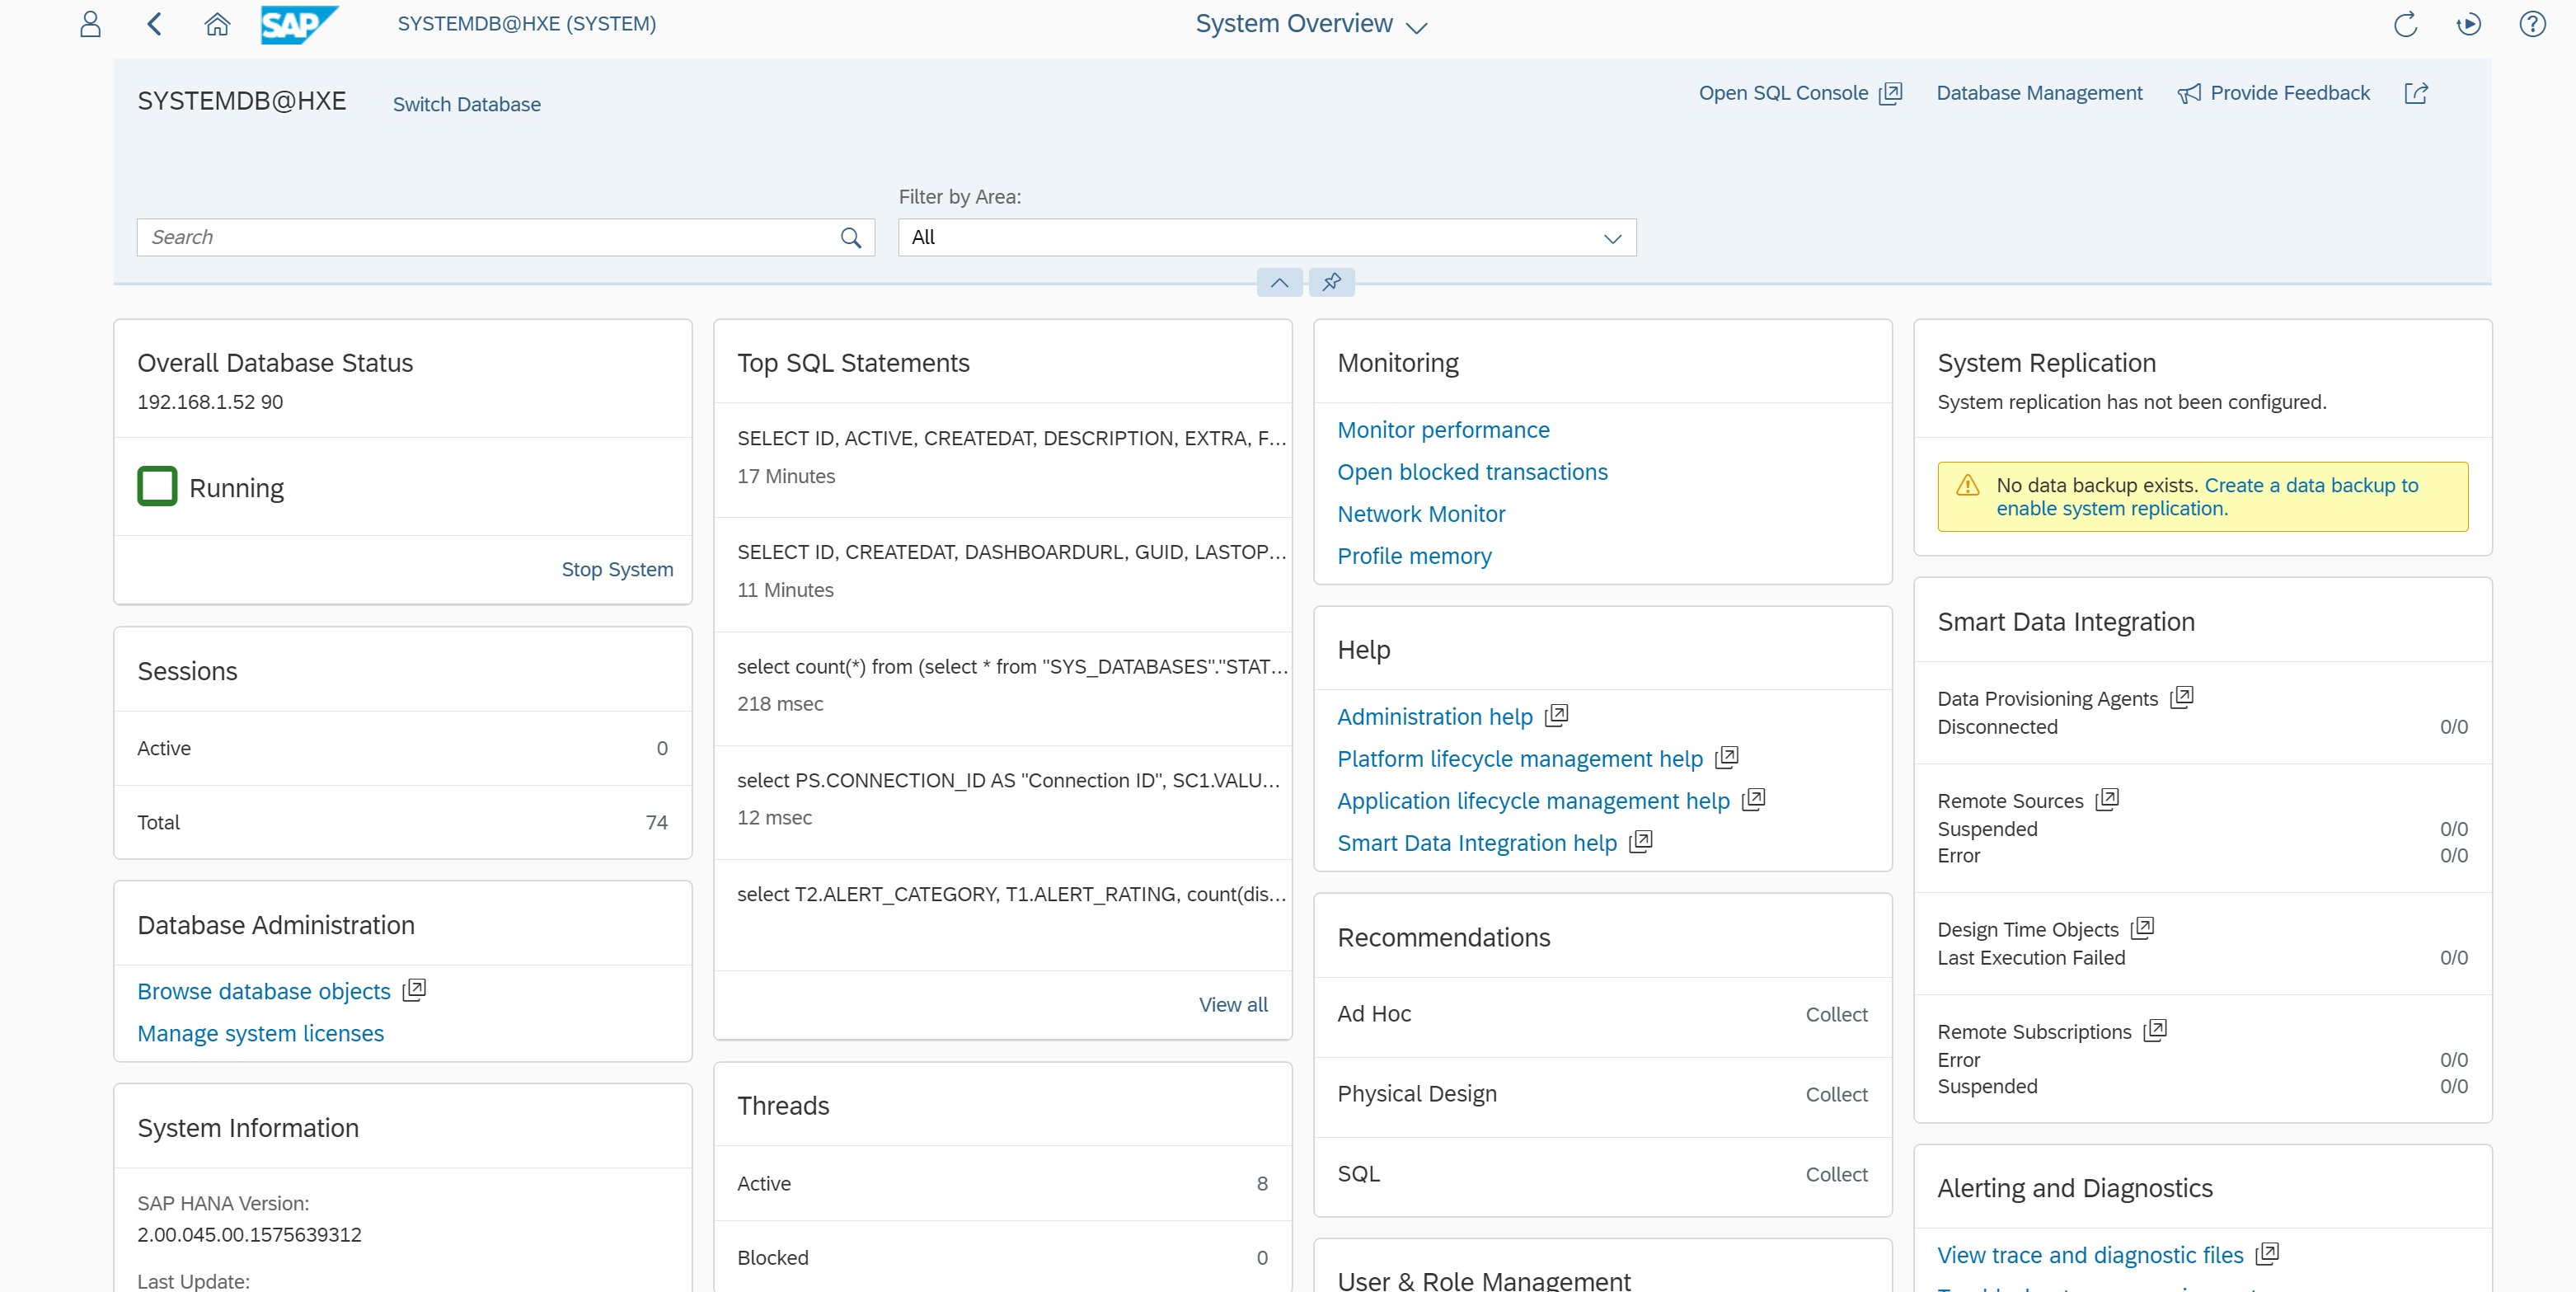
You can click on a specific areas you can get more details
After a while the apps start to collect data and it appears on the database main screen, here disk usage, memory useage and CPU usage apps have appeared.
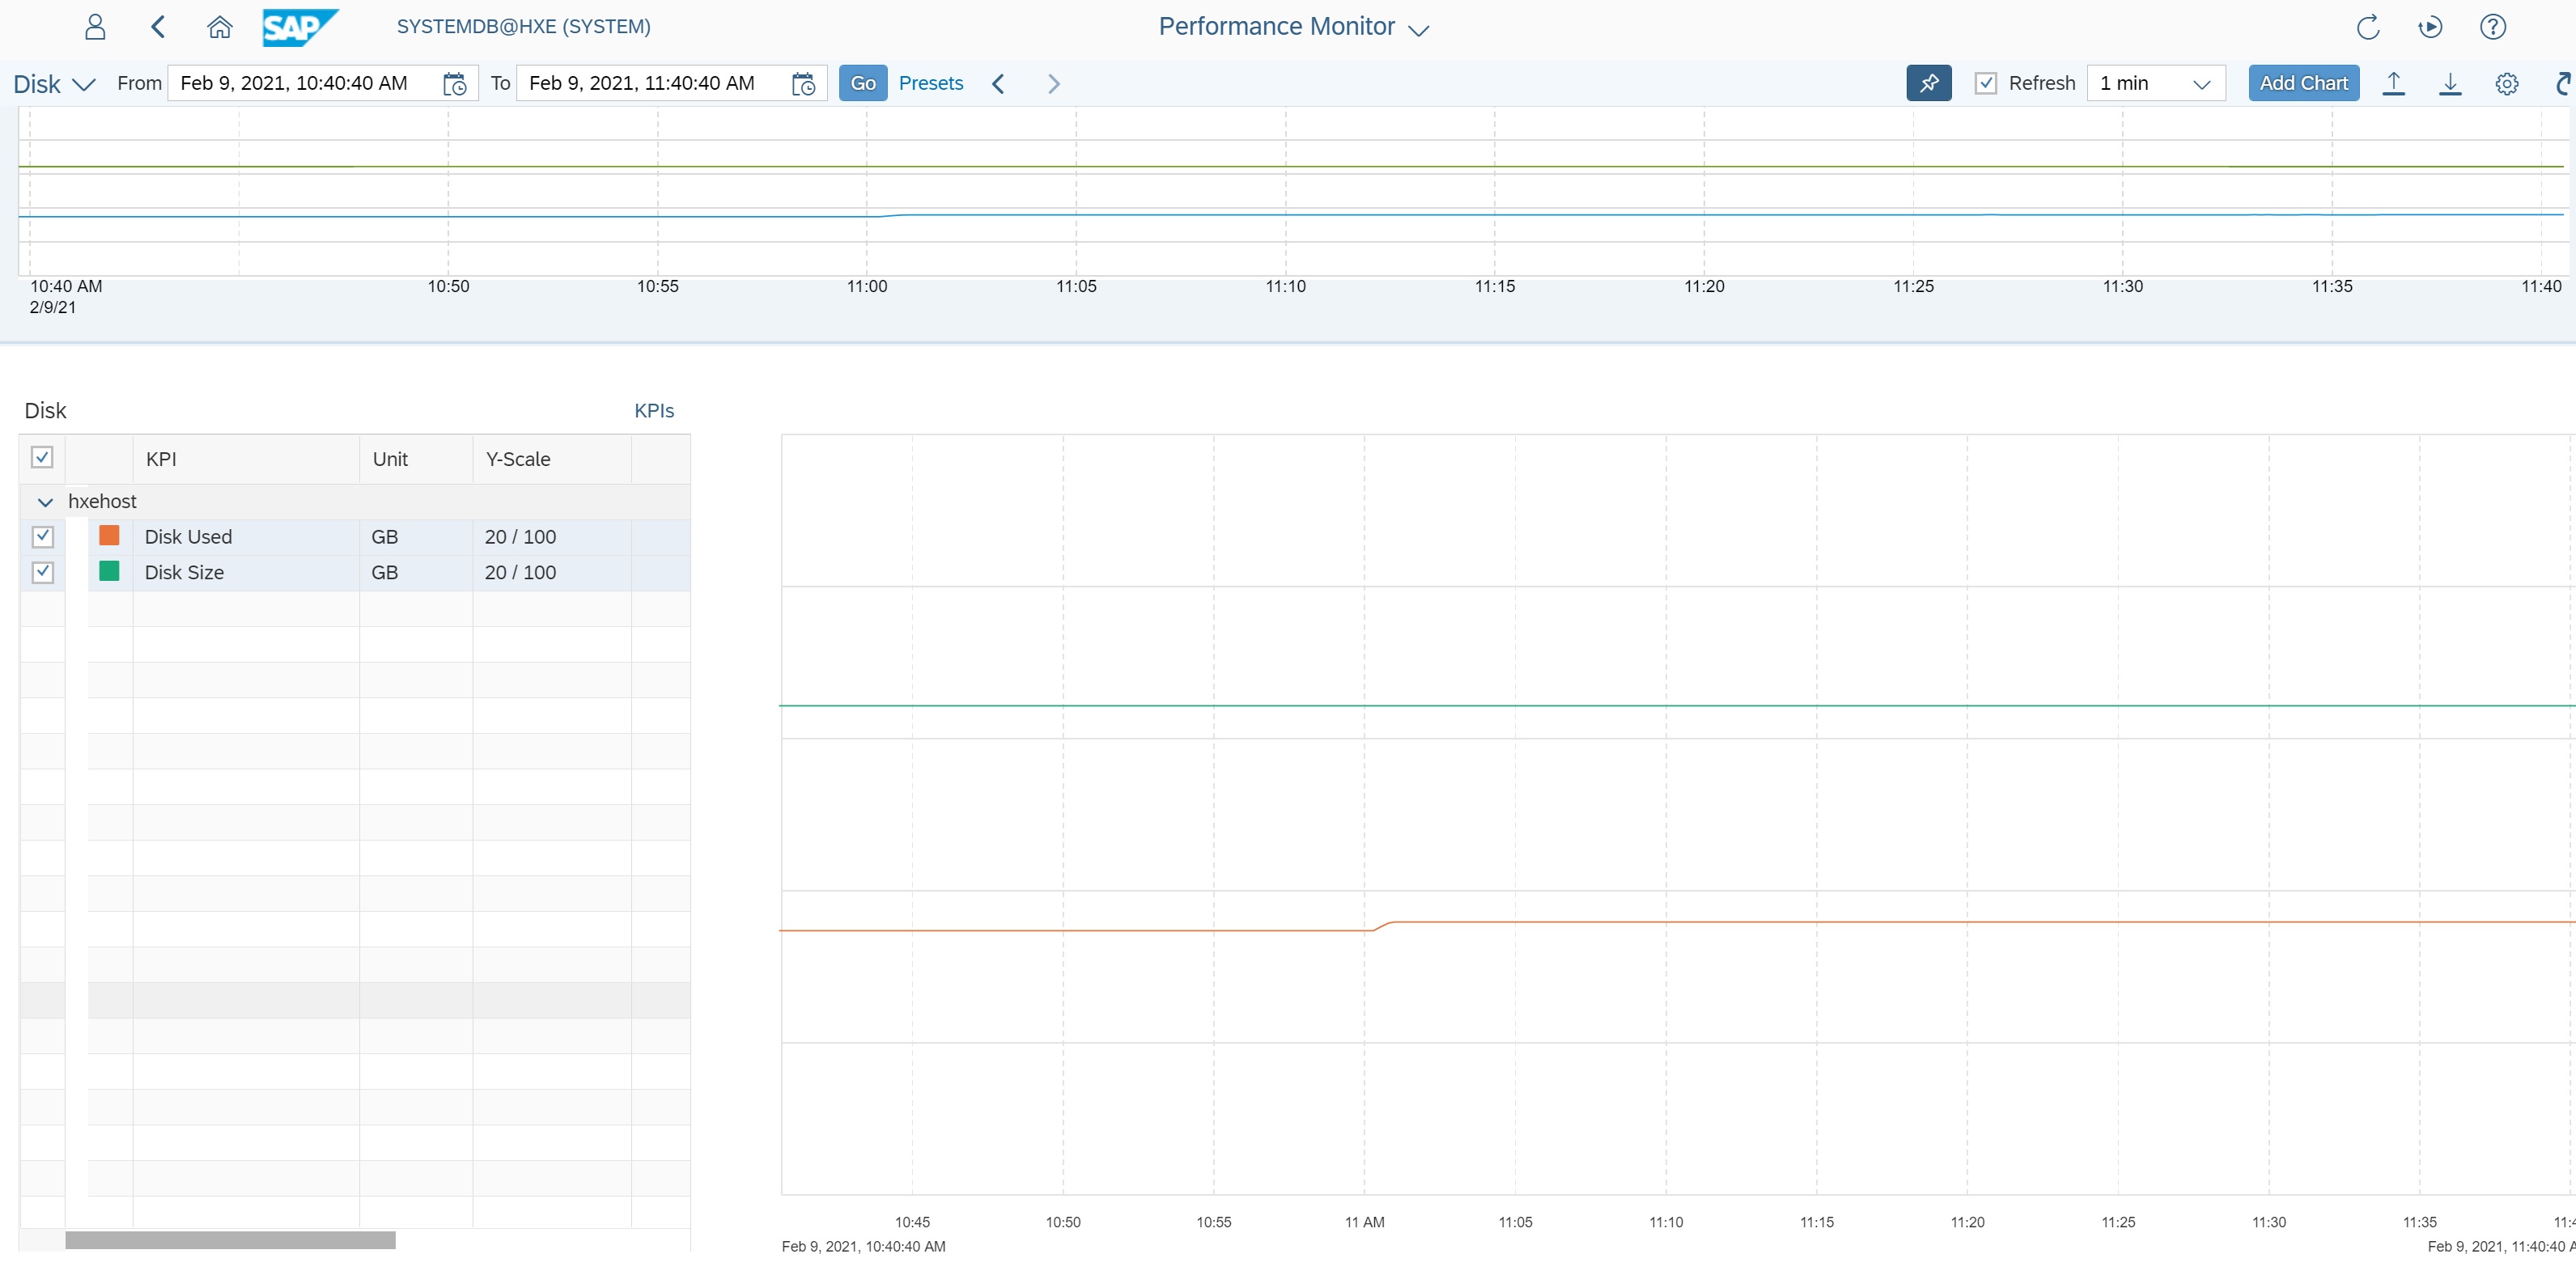
You can click on any one of these and you are taken to a graphical view, below I have click on the disk usage app
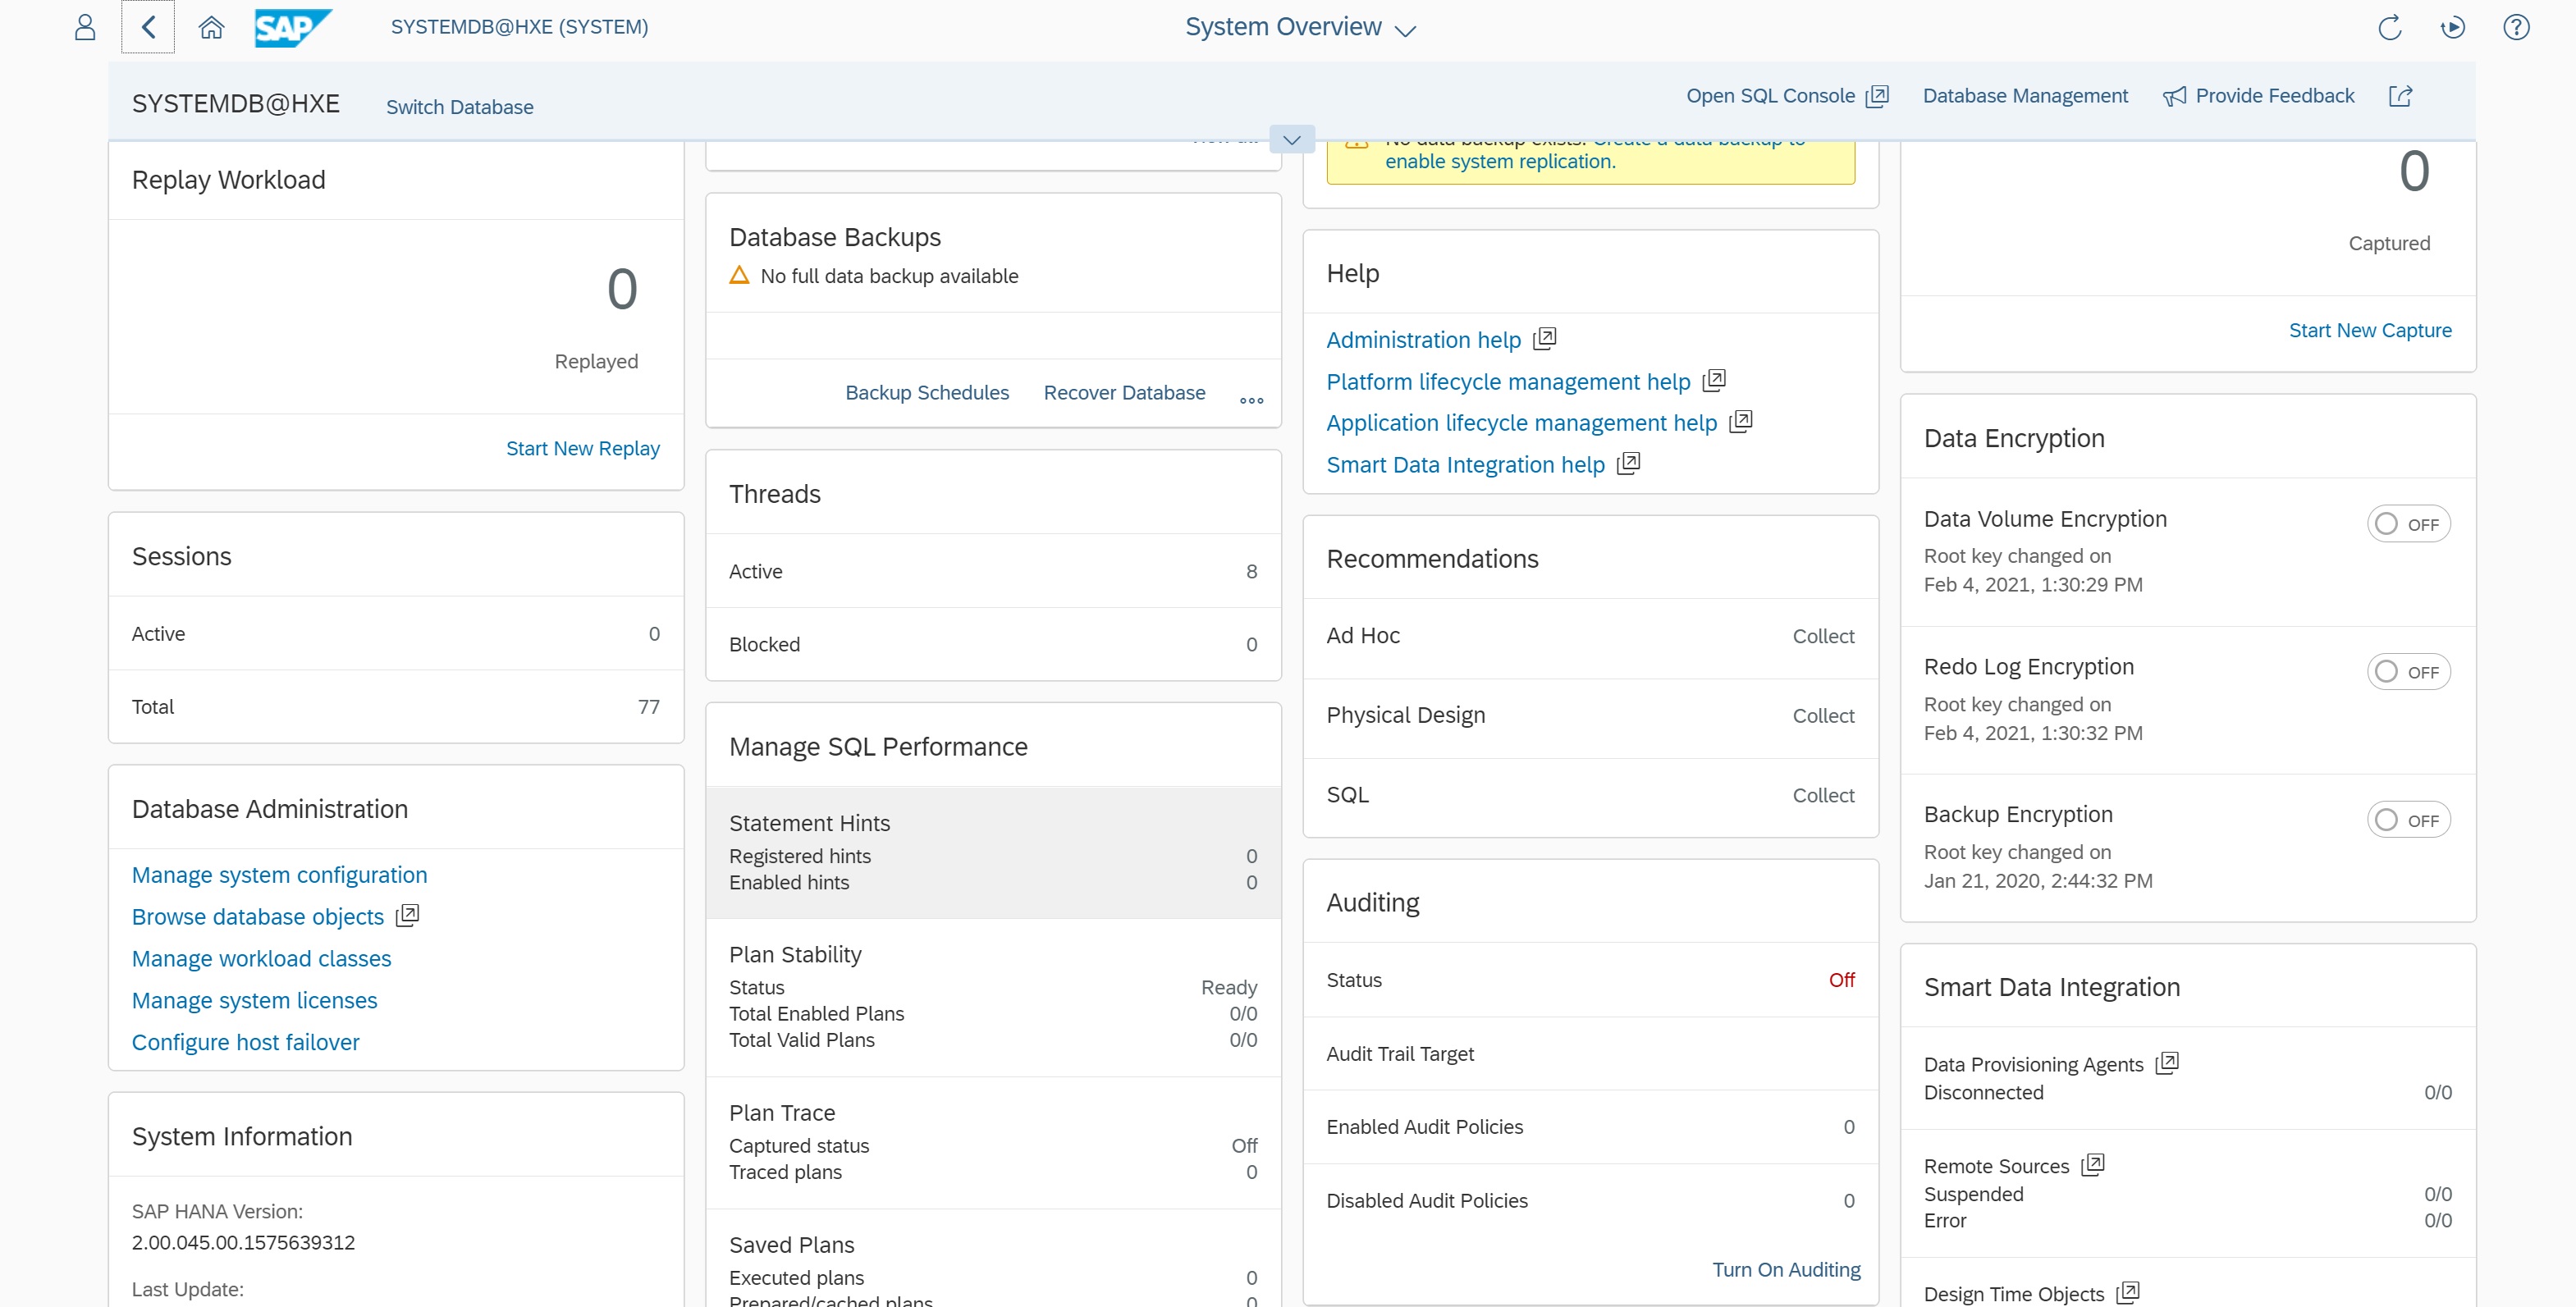
Scrolling down the main database page you have details on sessions, backups, data encryption, etc.