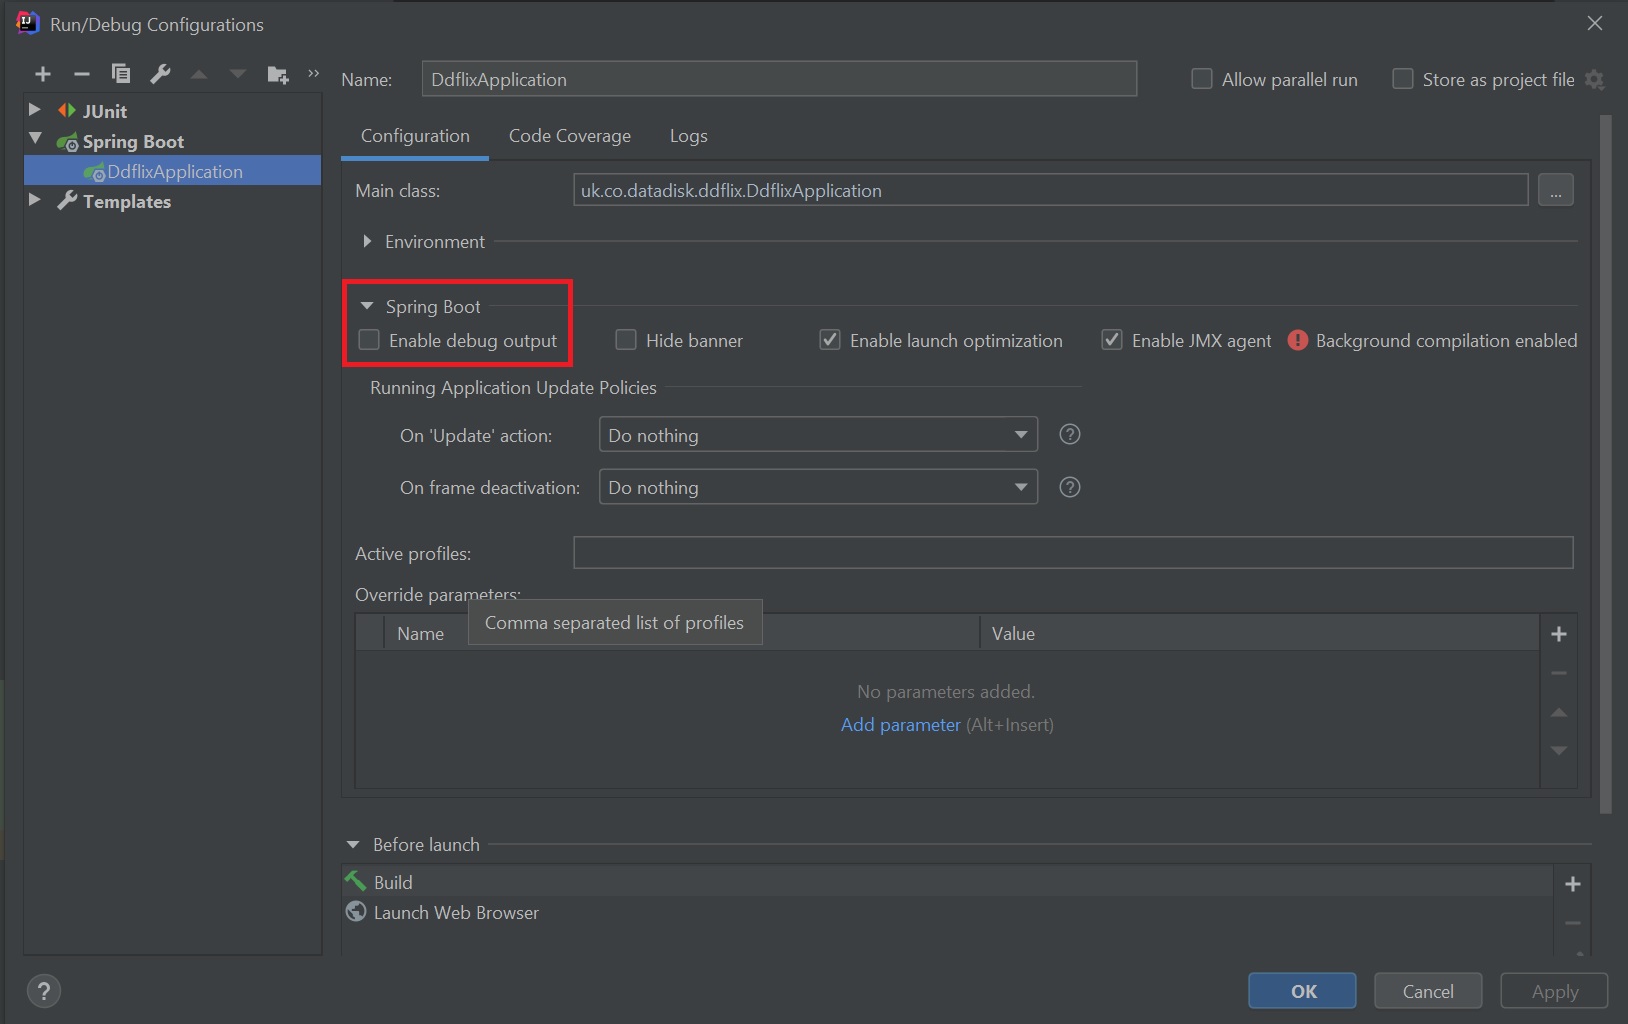
Most IDE's have a debug option in regards to Spring Boot, below you can see Intellij's debug option for Spring Boot, setting this option allows you to see alot of debugging information, including JPA, Seecurity, etc.
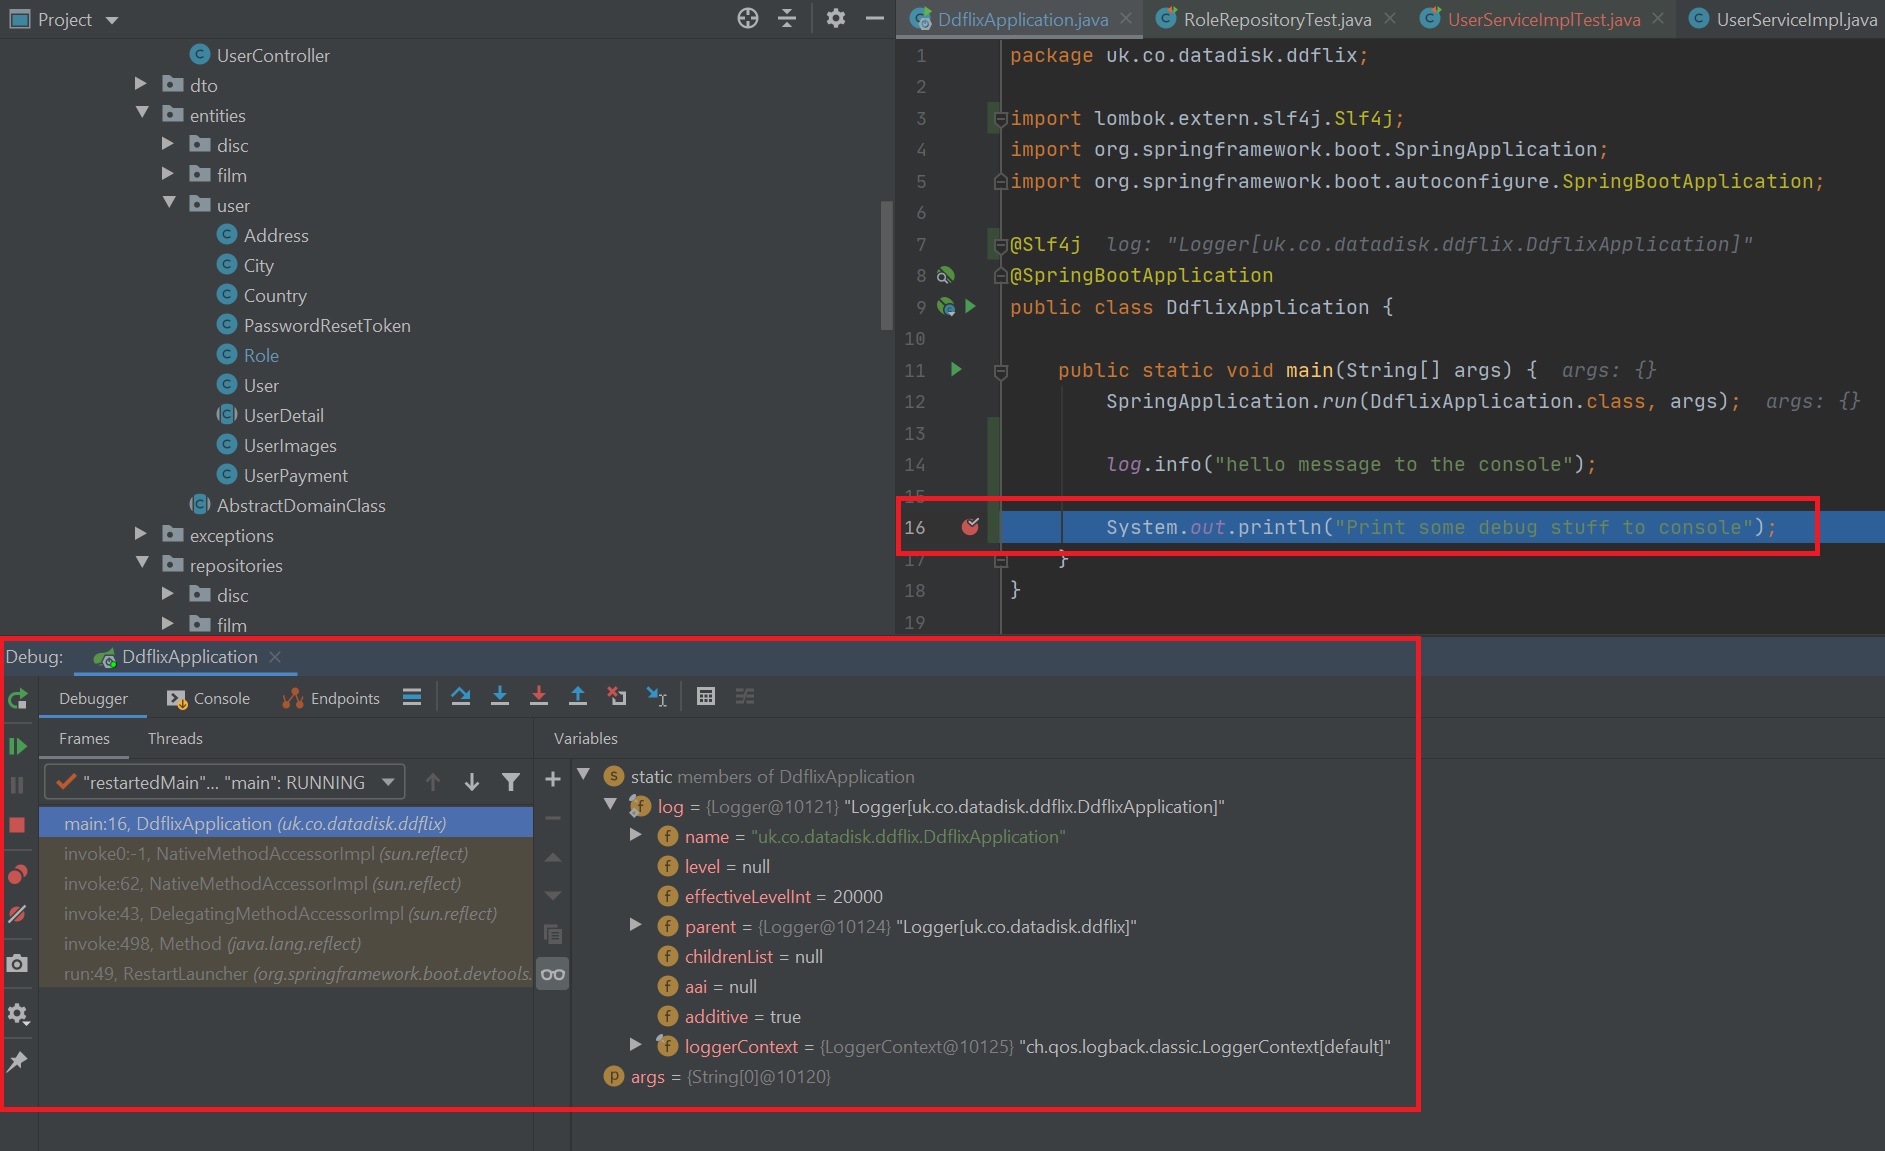
Most IDE's have a debugger that allows you to set breakpoints within the code, the debugger will stop at this point for you to examine fields (variables), objects, etc. In the below screenshot you can see the breakpoint at line 16, the application will stop at this point and at the bottom you can see the objects, etc in the debugger window, the debugger then allows you to step through the code examining various objects, etc which allows you to find bugs within the code.
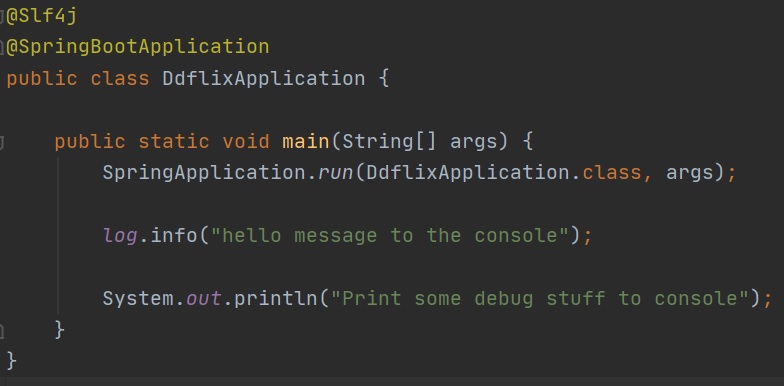
Creating a Logger or using one of the number of lombok log annotations like @Slf4j to either log data to the console (or file) can help, also don't forget the trusted System.out.println can print debug information.
There are number of application properties that you can use from spring logging to JPA or Hibernate, below are some examples
| Introduction | logging.level.root=DEBUG logging.level.org.springframework.web=DEBUG logging.level.org.hibernate=ERROR logging.level.org.hibernate.SQL=DEBUG logging.level.org.hibernate.type.descriptor.sql.BasicBinder=TRACE spring.jpa.show-sql=true spring.jpa.properties.hibernate.format_sql=true logging.level.org.springframework.jdbc.core.JdbcTemplate=DEBUG logging.level.org.springframework.jdbc.core.StatementCreatorUtils=TRACE logging.level.tomcat=TRACE |